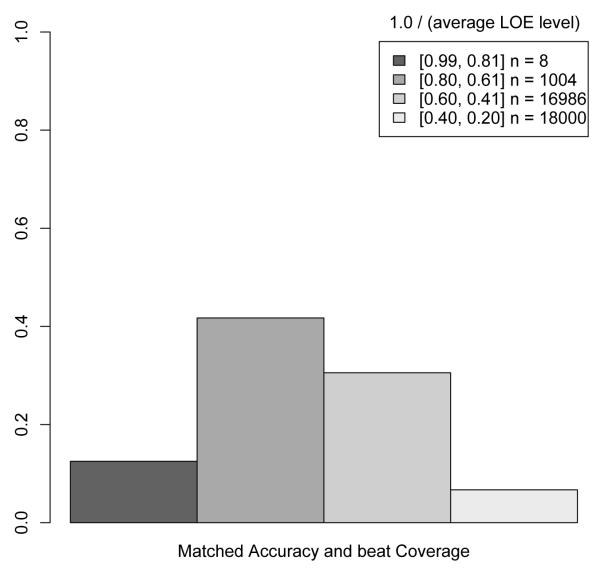
Fig. 5.
A barplot of the proportion of belief criteria strategies at four different stringency levels that matched the accuracy but had better coverage than the most stringent strategy. Figure 4 explains the numerical metric for stringency that is used in this plot. The plot makes it clear that less stringent strategies often result in a greater coverage of known interactions with no loss of accuracy.

