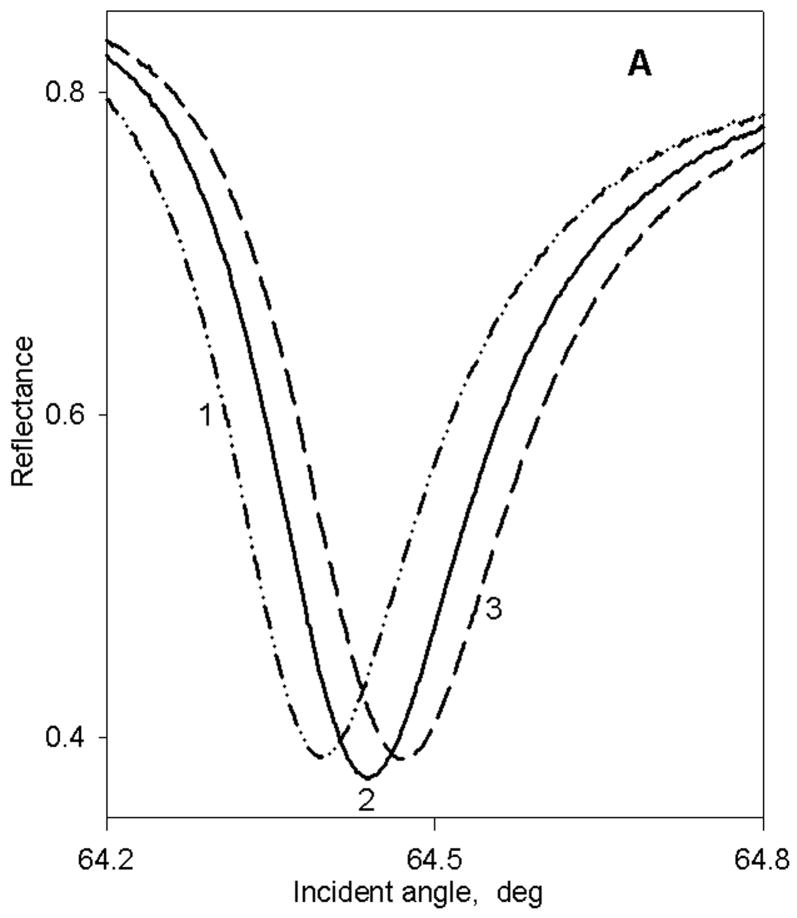
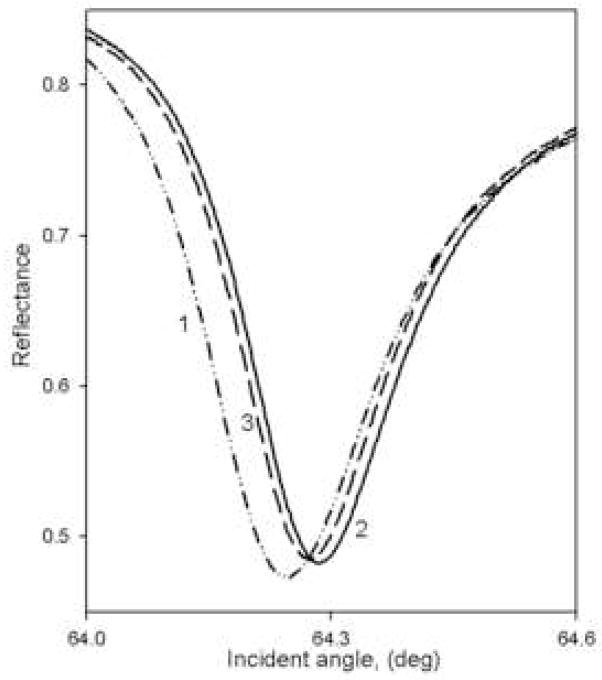
Figure 1.
Typical p-polarized PWR spectra obtained with either a bare sensor in contact with an aqueous buffer (dashed-dotted line; curve 1), after membrane fragment deposition and washing (solid line; curve 2), and after addition of ligand to the sample compartment at a saturating ligand concentration (dashed line; curve 3; see Figs. 2–5). Panel A: chromatophore membrane fragments with and without added cyt c2; binding curves shown in Figure 2A. Panel B: rat trigeminal ganglion membrane fragments with and without added CP; binding curves shown in Figure 4A.


