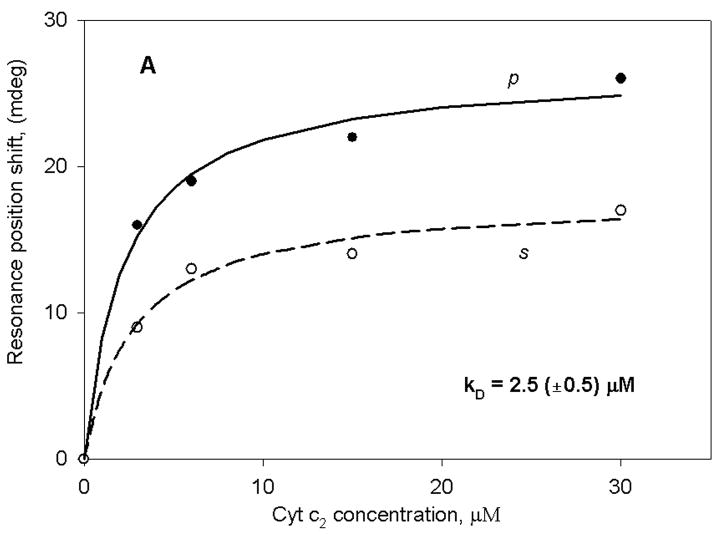
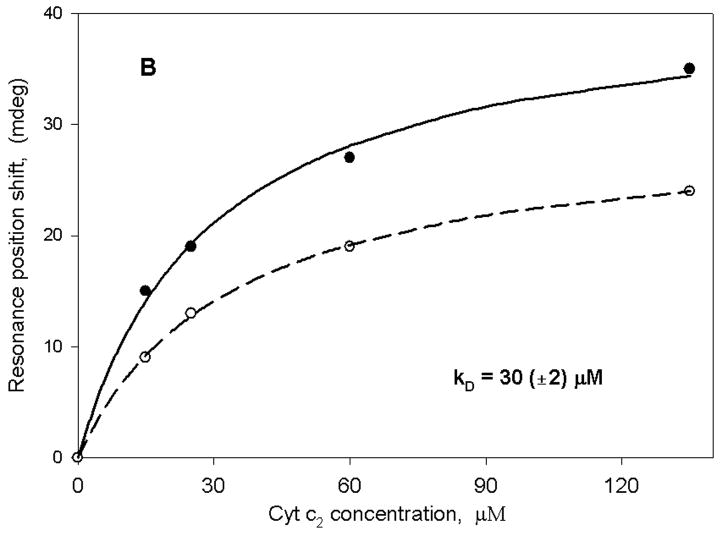
Figure 2.
PWR spectral position minimum for both p (solid line) and s (dashed line) polarized excitation light plotted as a function of the concentration of cyt c2 in the sample cell compartment. (A) addition of cyt c2 to sample cell with chromatophore membrane fragments deposited on the sensor surface and (B) addition of cyt c2 to sample cell with a bare sensor surface (without the membrane fragments).


