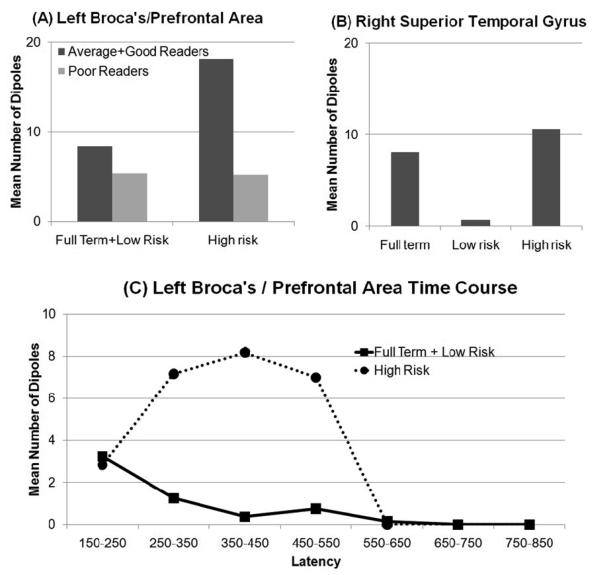
Figure 2.
Dipole activation in the (A) combined Broca's and prefrontal area and (B) right superior temporal gyrus, during the non-word rhyme task. (A,B) Mean number of dipoles over the 400ms (150ms-550ms) analysis period. (C) Time course analysis showing mean number of dipoles per 100ms for a extended period (* indicates a significant difference between the birth groups). Note that error bars are not included in the graphs since these data are derived from a discrete distribution in which the mean and variance are directly related to each other.

