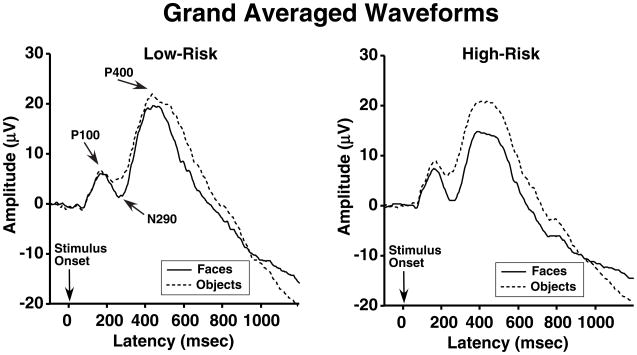
Figure 1. Grand Averaged Waveforms Showing the P100, N290 and P400 Occipital-Temporal Components for Low-Risk (Left Panel) and High-Risk (Right Panel) Infants.
Amplitude (mv) vs. Latency (msec) is plotted for Faces (solid red lines) and Objects (dashed blue lines). Waveforms reflect data collapsed across familiar/unfamiliar stimuli and left/right hemispheres. For clarity, P100, P290 and P400 components are labeled for the Low-Risk infants. See text and Figure Legend 2 for full description of statistical analyses based on individual subject values.

