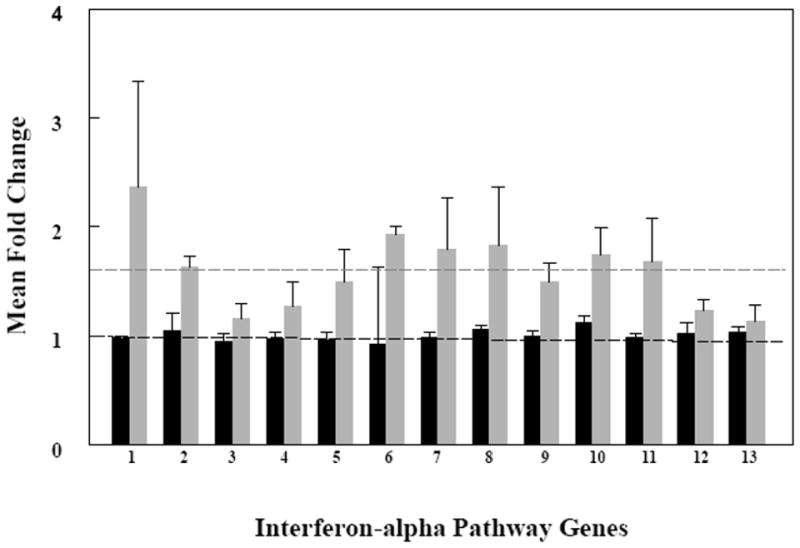
Figure 1.

Expression of interferon-related genes in the activated T cells from SLE patients (n=6) increased in response to estradiol but not in the activated T cells from healthy donors (n=5). Activated T cells were cultured without and with estradiol. Fold change (FC) values were calculated from gene profiling data as a ratio of expression levels with estradiol compared to expression levels without estradiol from the same individuals. The mean FC for thirteen genes representing those associated with the interferon-α pathway are displayed (1–13). Dark bars (black) are mean FC values from all T cell samples obtained from control females. Light bars (gray) are mean FC values from all T cell samples obtained from female SLE patients. The horizontal lines represent mean FC values for each group, 1.0 for the control T cells and 1.6 for the SLE T cells. 1 = DRIP150; 2 = IFIT1; 3 = IFNAR1; 4 = INFAR2; 5 = JAK1; 6 = JAK2; 7 = OAS1; 8 = PTPN11; 9 = PTPN2; 10 = SEC14; 11 = SOCS1; 12 = STAT1; 13 = STAT2.
