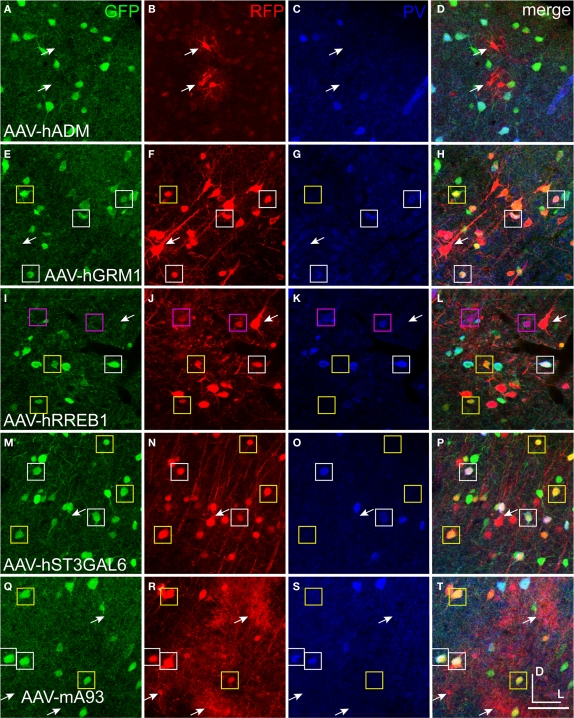
Figure 11.
Mammalian conserved TFBS promoters drove expression in mouse brain. GAD67-GFP knock-in mice were injected with AAV expressing RFP driven by promoter sequences with presumed cell-type specific regulatory elements. Images in each row are images of the same section. Green label in the first column on the left (A,E,I,M,Q) is inhibitory neuron specific GAD67-GFP expression. Red label in the second column from the left (B,F,J,N,R) is RFP virus expression. Blue label in the third column from the left (C,G,K,O,S) is parvalbumin (PV) antibody label. The right column (D,H,L,P,T) is the merge of the previous columns. Overlap of green and red is yellow; green and blue is teal; red and blue is purple; green, red and blue is white. Viral vectors were as follows: adrenomedullin [AAV-hADM – (A–D)], glutamate receptor, metabotropic 1 [AAV-hGRM1 – (E–H)], ras responsive element binding protein 1 [AAV-hRREB1 – (I–L)], type 2 lactosamine alpha-2,3-sialyltransferase [AAV-hST3GAL6 – (M–P)] and riken gene A930038C07Rik [AAV-mA93 – (Q–T)]. Examples of double and triple labeled cells are marked with boxes. The color of the box matches the cell overlap color. Rightward pointing arrows mark glia and leftward pointing arrows mark excitatory pyramidal neurons. Dorsal (D) and lateral (L) directions for all images are as indicated in (T). Scale bars are 50 μm.

