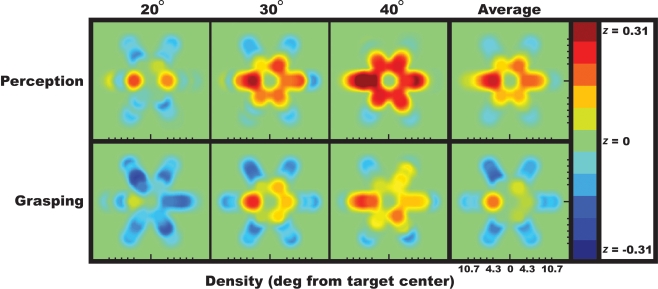
Figure 3.
Visualization of the data plotted in Figure 2B across space. For each possible distractor position, this heatmap reveals how the flanker bars capture (red) or repel (blue) the perceived or grasped target bar orientation. Each panel shows the degree to which observers’ perceptual or visuomotor responses correlated with each of the six distractor positions at each eccentricity. While flankers tended to capture or attract the perceived target orientation, they tended to repel the grasped target orientation.

