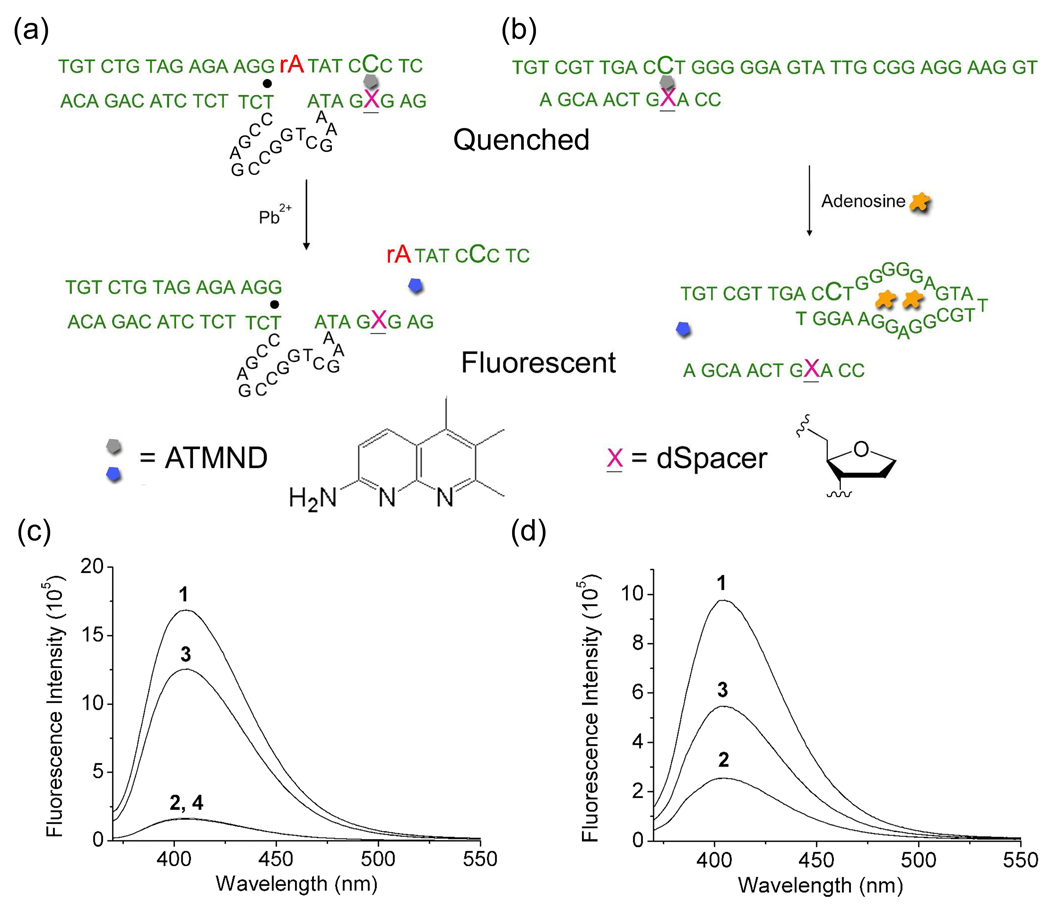
Figure 1.
Schematic illustration of label-free fluorescent detection of Pb2+ (a) and adenosine (b), and the fluorescence emission spectra of ATMND in the absence and presence of 17Eab-17S (c) and APP-L1ab (d) for Pb2+ and adenosine detection, respectively. The fluorescent spectra in (c) were collected in buffer A (25 mM HEPES pH 7.0 and 100 mM NaCl). 1: ATMND (1 µM); 2: ATMND (1 µM), 17Eab (2.14 µM) and 17S (1.02 µM); 3: ATMND (1 µM), 17Eab (2.14 µM), 17S (1.02 µM) and Pb2+ (1 µM) after 15 min reaction; 4: ATMND (1 µM), 17Eab (2.14 µM), 17S (1.02 µM), Pb2+ (1 µM) and EDTA (1 mM) after 15 min reaction. The fluorescent spectra in (d) were collected in buffer B (10 mM HEPES pH 7.0, 100 mM NaCl, 1 mM EDTA). 1: ATMND (500 nM); 2: ATMND (500 nM), AAP (918 nM) and L1ab (1.17 µM); 3: ATMND (500 nM), AAP (918 nM), S1 (1.17 µM) and adenosine (100 µM). The excitation wavelength was 358 nm. All spectra were recorded at 5 °C.

