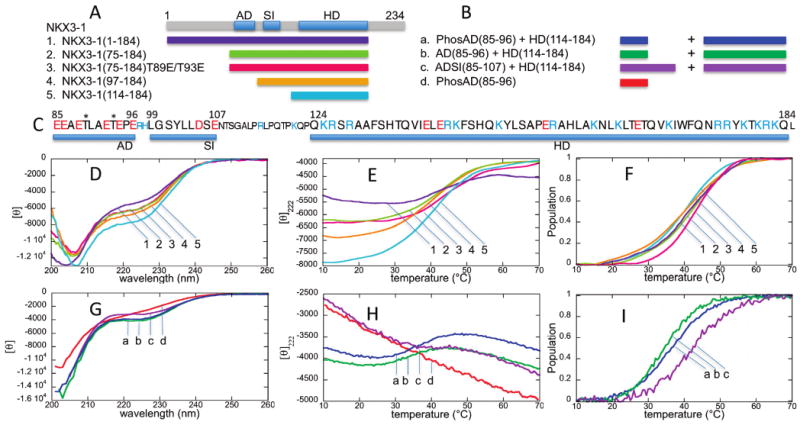
Figure 1.

CD spectra and thermal unfolding curves. (A) NKX3.1 constructs (1–5) used for CD spectroscopy with a diagram showing the locations of the acidic domain (AD) and SRF-interacting (SI) motifs and homeodomain (HD). (B) Peptide mixtures (a–d) with NKX3.1 (114–184) used for CD spectroscopy. (C) NKX3.1 sequence highlighting the AD, SI, and HD sequences, shown in the larger font. Negatively charged residues are colored red and positively charged residues blue. The two threonine phosphorylation sites are denoted with asterisks. (D) CD spectra at 20 °C for NKX3.1 constructs (1–5). (E) Thermal unfolding curves at 222 nm for NKX3.1 constructs (1–5). (F) Unfolded population curves for NKX3.1 constructs (1–5) as a function of temperature. (G) CD spectra at 20 °C for NKX3.1/peptide mixtures (a–d). The molar ellipticity corresponds to the spectrum for the phosphorylated AD peptide; for the mixtures, the CD units are relative. (H) Thermal unfolding curves at 222 nm for NKX3.1/peptide mixtures (a–d). (I) Unfolded population curves for NKX3.1/peptide mixtures (a–c) as a function of temperature. The peptide alone (d) showed no unfolding transition.
