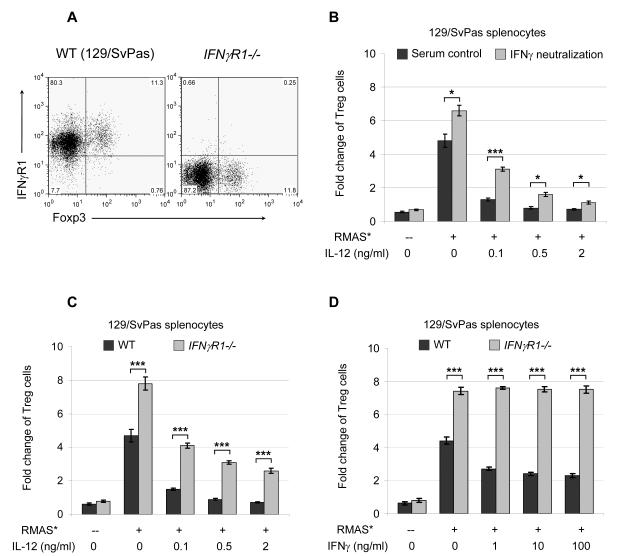
Figure 4. IFNγ signaling partially accounts for IL-12 mediated Treg inhibition.
A. Representative flow cytometric plots for IFNγ receptor 1 expression in naive WT 129/SvPas splenocytes and strain-matched IFNγ receptor 1-deficient (IFNγR1-/-) splenocytes. Shown are cells in the CD4+ gates. 6 mice in each genotype were examined in 2 independent experiments, with similar results. B. An IFNγ neutralizing antibody, H22, or its isotype control, PIP, was added to a final concentration of 50 μg/ml. A summary of 2 independent co-culture experiments is shown. C. RMAS tumor cells were cultured with WT 129/SvPas splenocytes or IFNγR1-/- splenocytes for 5 days. A summary of 3 independent experiments is shown. D. Indicated doses of IFNγ were used to treat the co-cultures. A summary of 2 independent experiments is shown. Treg expansion is presented as fold-change of the final yield over initial input (as described in the Methods and Figures 1 and S1). Data points are shown as mean ± SD; Two-tailed t-tests were used to determine statistical significance (*P<0.05, **P<0.01, ***P<0.001).

