
Figure 5.
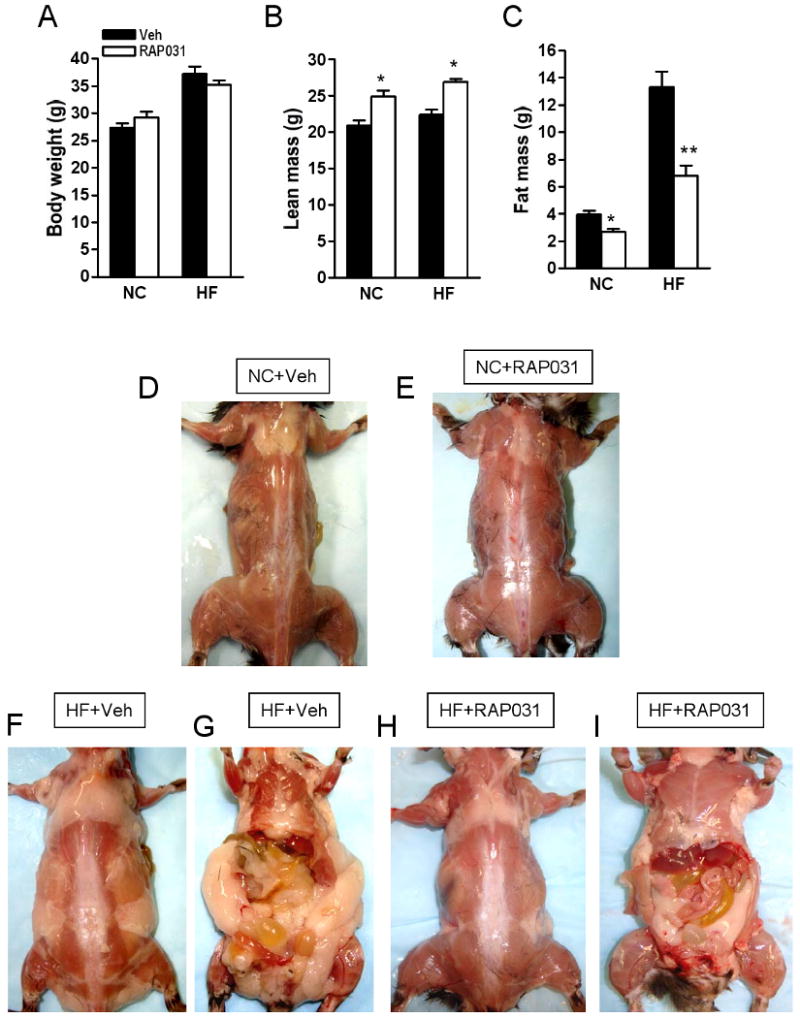
Effects of 10 weeks RAP-031 treatment (white bar) or vehicle (black bar) on (A) body weight, (B) lean mass, (C) fat mass. Data are mean ± SEM. N=5; *P<0.01 vs vehicle; **P<0.001 vs vehicle. NC, normal chow diet; HF, high-fat diet. Photographs showing the effects of (D) vehicle and (E) RAP-031 treatment on muscle and fat in the dorsal region of NC mice. Effects of (F, G) vehicle or (H, I) RAP-031 treatment on fat and muscle in HF mice.