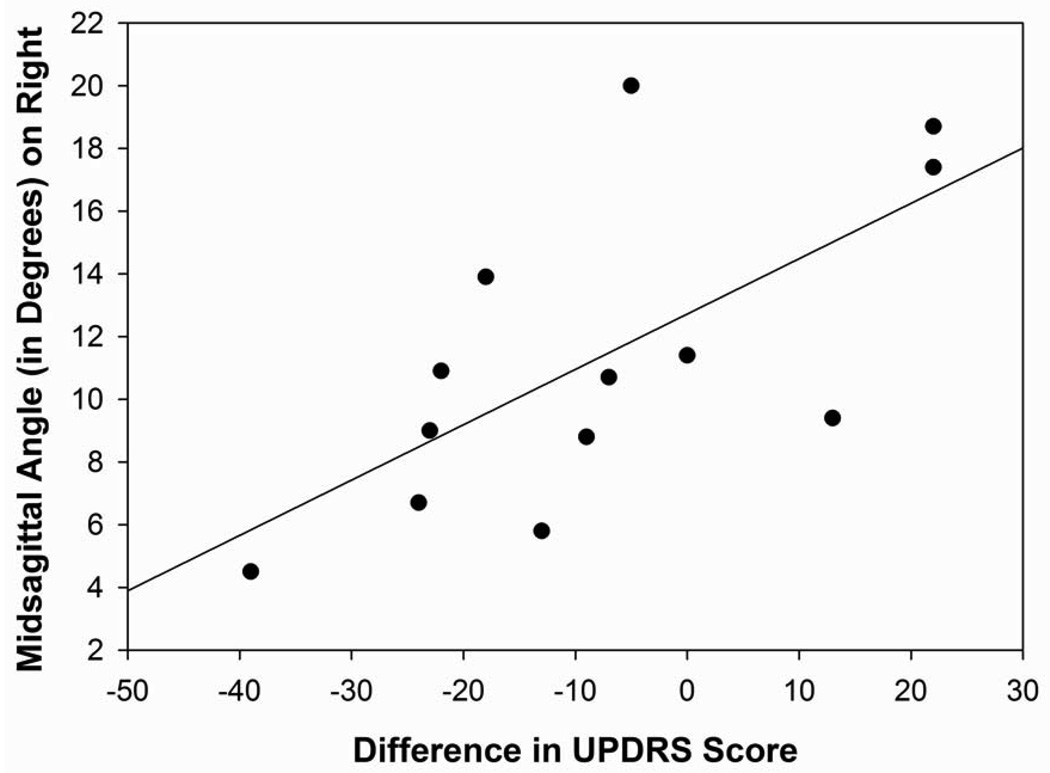
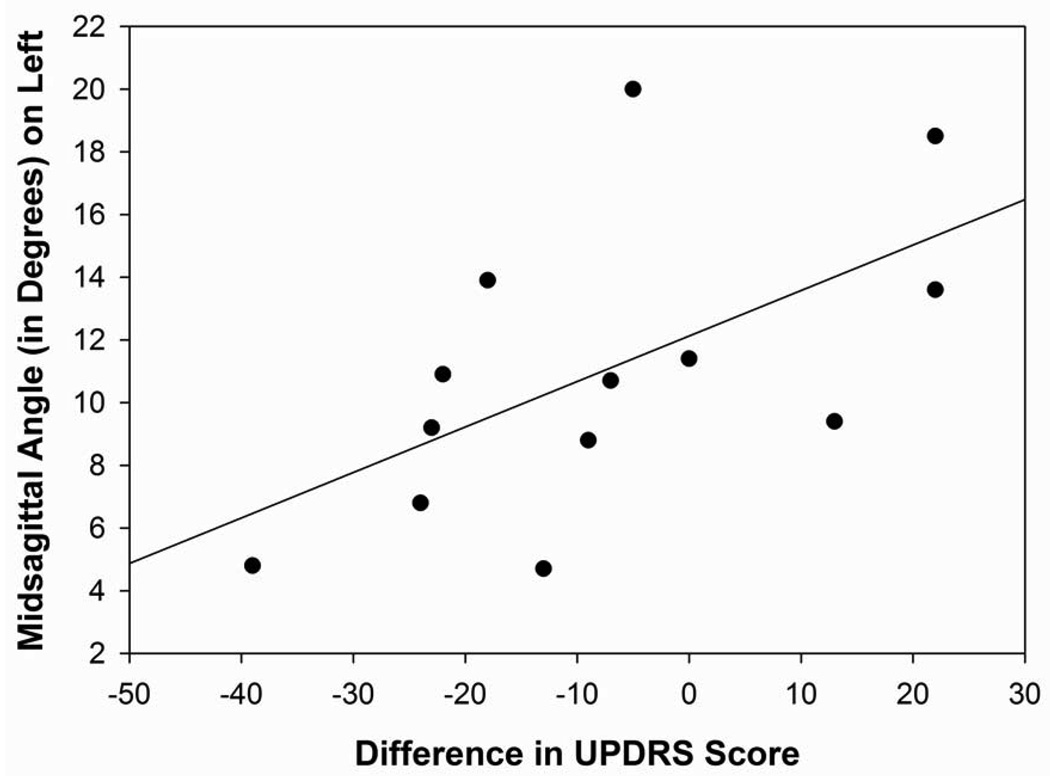
Figure 3. Figures 3A, 3B: Motor Outcome.
Figure 3A: Scatterplot with regression line demonstrating the relationship between the angle of the surgical trajectory to the electrode tip in relation to the midsagittal plane in the right hemisphere with motor outcome. (p=0.01)
Figure 3B: Motor Outcome. Scatterplot with regression line demonstrating the relationship between the angle of the surgical trajectory to the active electrode in relation to the midsagittal plane in the right hemisphere with motor outcome. (p=0.04)


