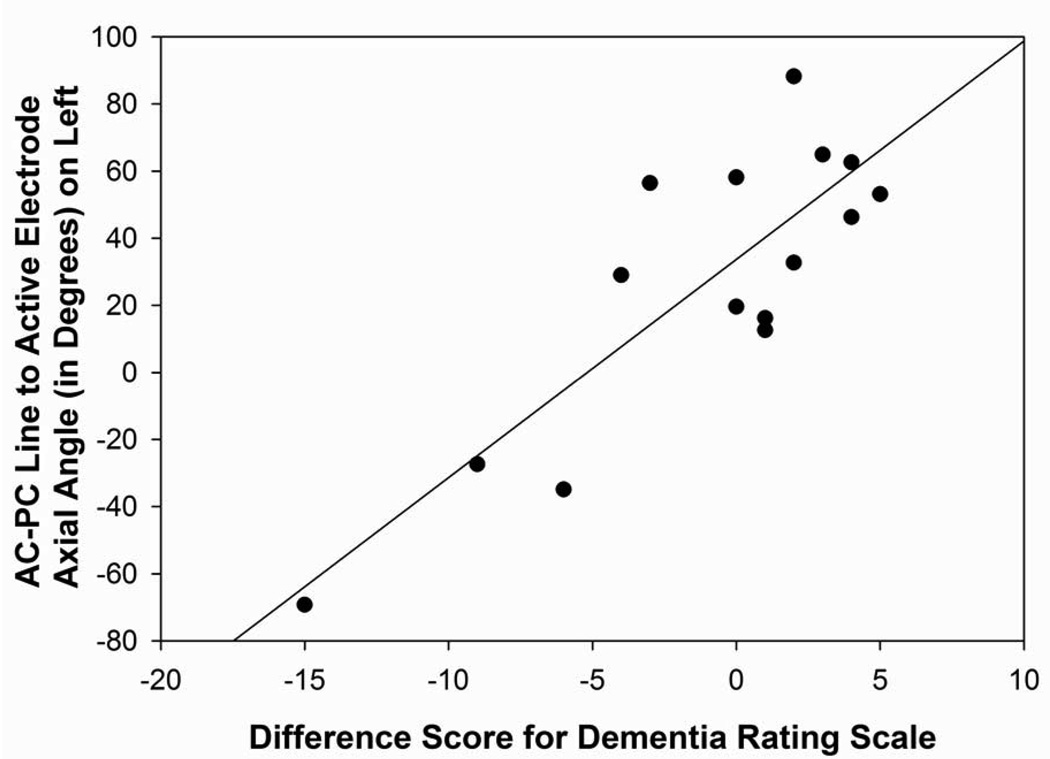
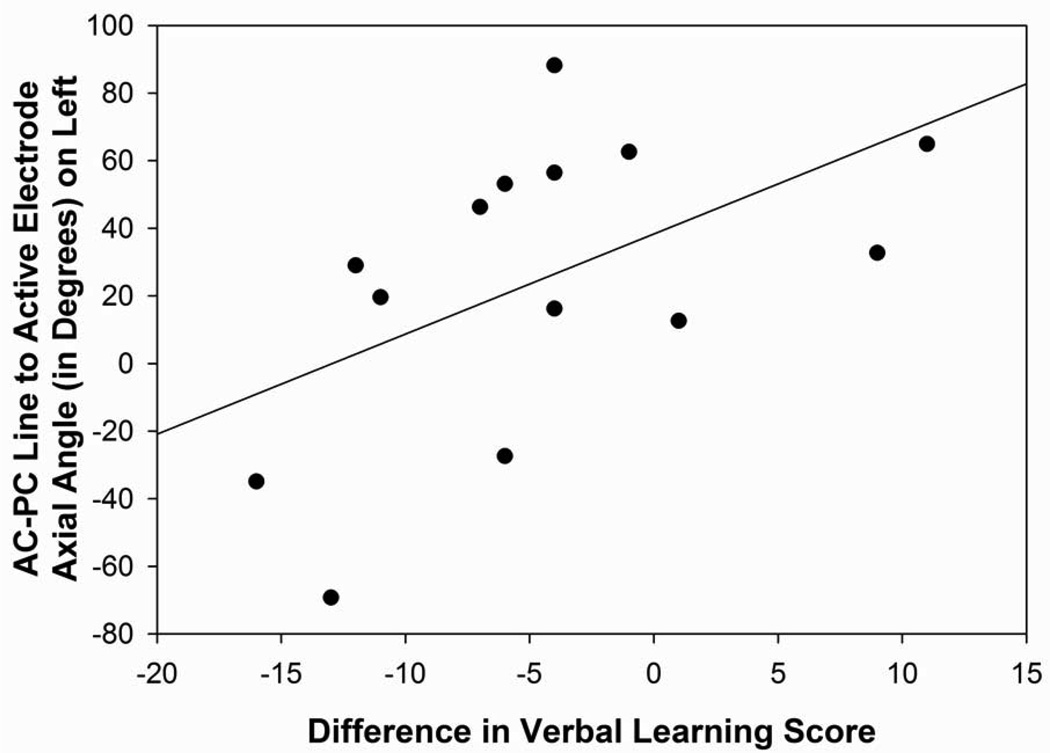
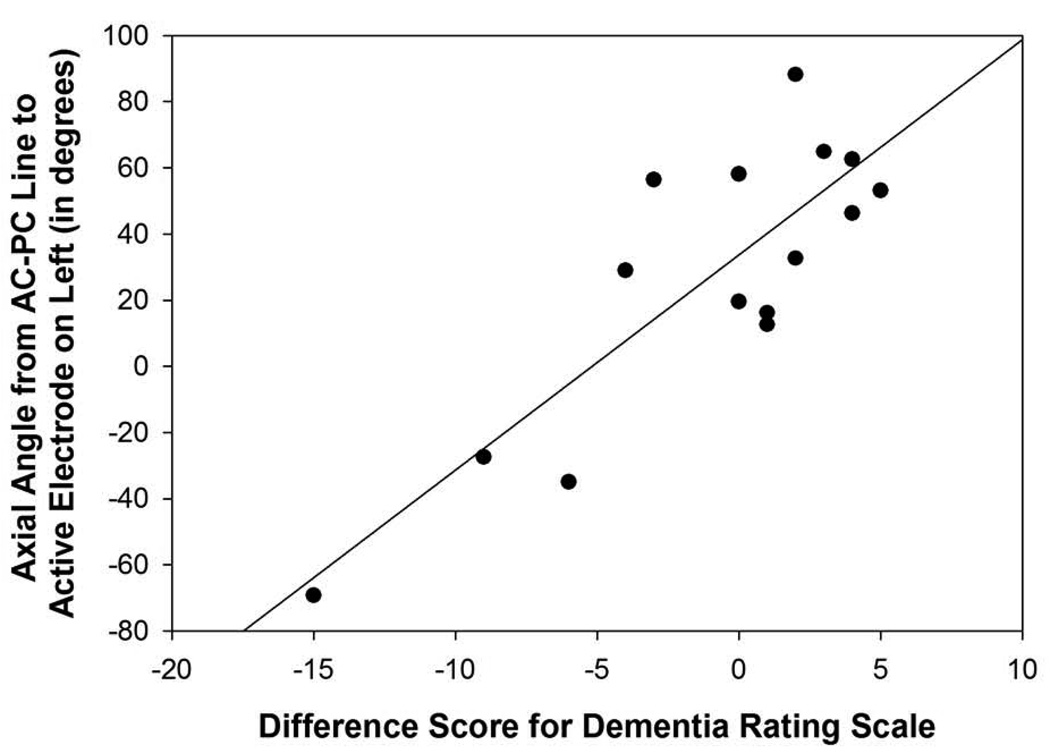
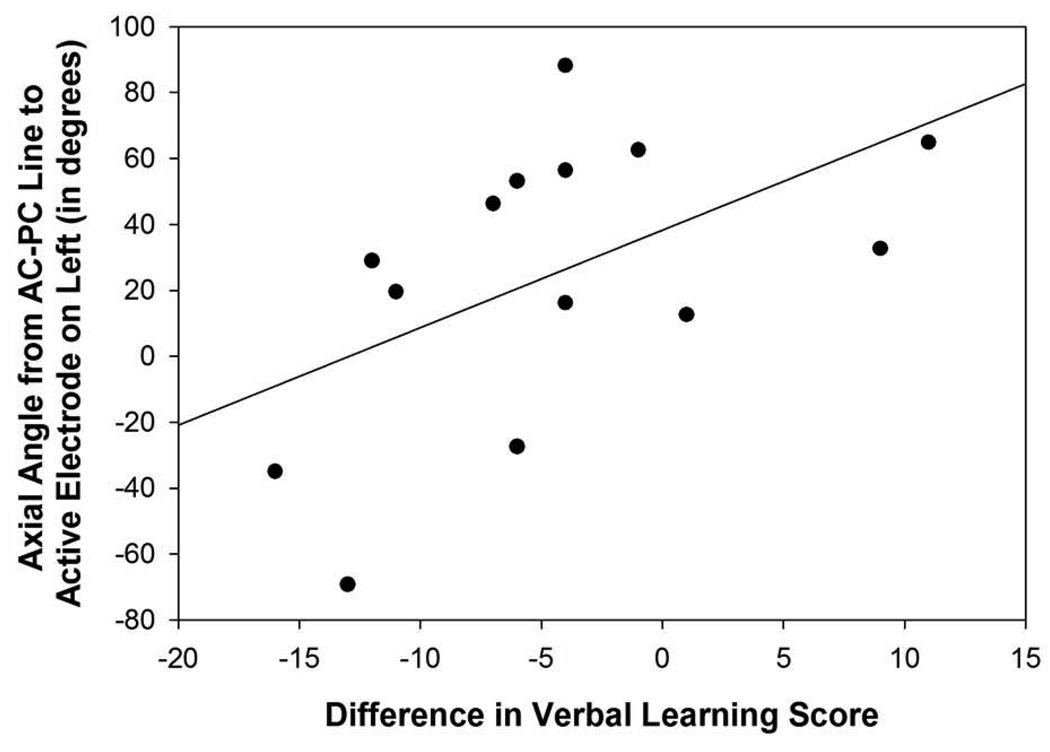
Figure 5. Figures 5A–D: Angle Measurements.
Figure 5A: Scatterplot with regression line demonstrating the relation between the angle from the midpoint of the AC-PC line to the electrode tip in relation to the midsagittal plane in the left hemisphere and Dementia Rating Scale difference scores. The lower the angle reflects a more posterior-lateral direction in the frontal quadrant and a lower difference score reflects a greater decline in mental status performance following surgery (p=0.007).
Figure 5B: Scatterplot with regression line demonstrating the relation between the angle from the midpoint of the AC-PC line to the electrode tip in relation to the axial plane in the left hemisphere and verbal short-term memory difference scores. The lower the angle reflects a more superior direction and a lower difference score reflects a greater decline in verbal short-term memory performance following surgery (p=0.005).
Figure 5C: Scatterplot with regression line demonstrating the relation between the angle from the midpoint of the AC-PC line to the active electrode in relation to the axial plane in the left hemisphere and Dementia Rating Scale difference scores. The lower the angle reflects a more superior direction and a lower difference score reflects a greater decline in mental status performance following surgery (p=0.001).
Figure 5D: Scatterplot with regression line demonstrating the relation between the angle from the midpoint of the AC-PC line to the active electrode in relation to the axial plane in the left hemisphere and verbal learning difference scores. The lower the angle reflects a more superior direction and a lower difference score reflects a greater decline in verbal learning (p=0.05).


