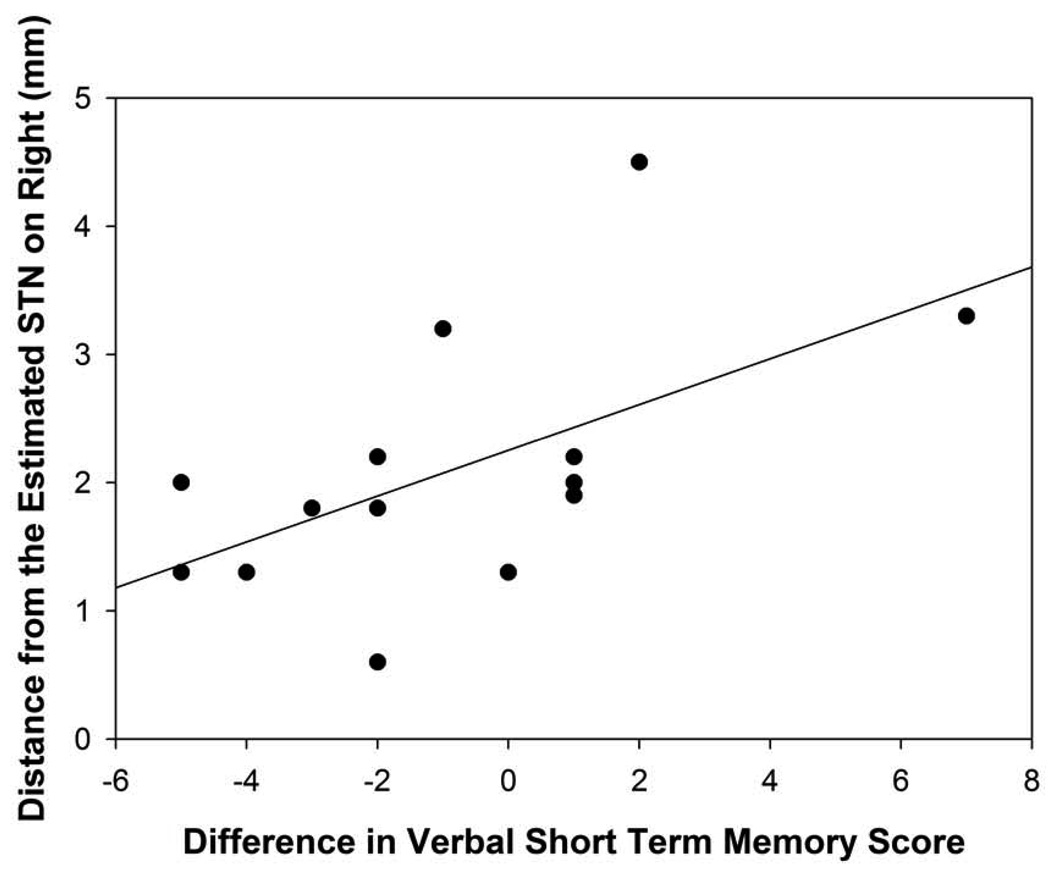
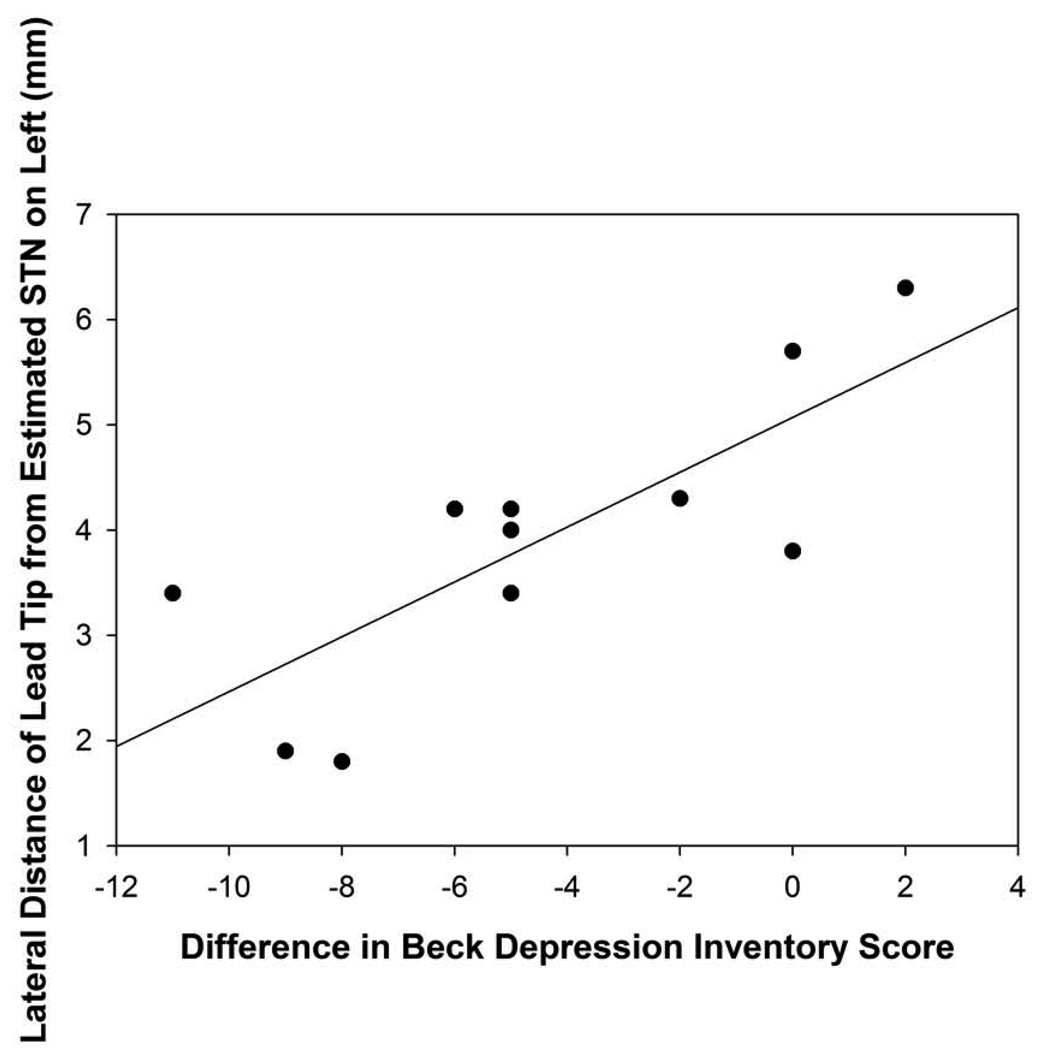
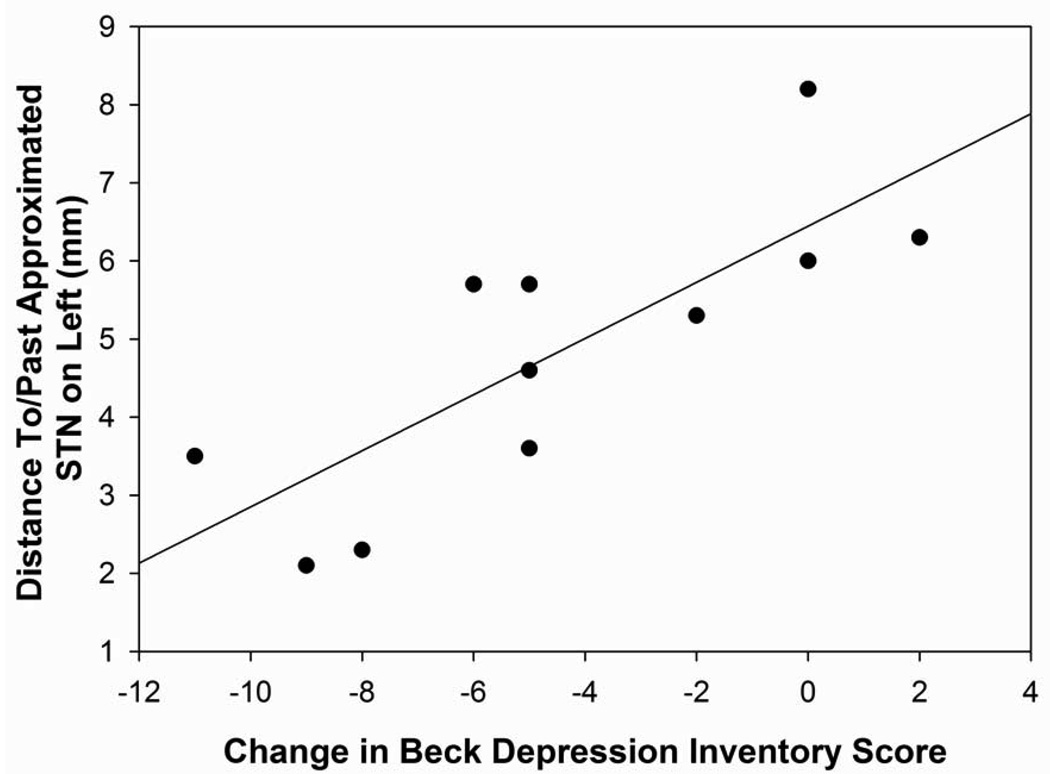
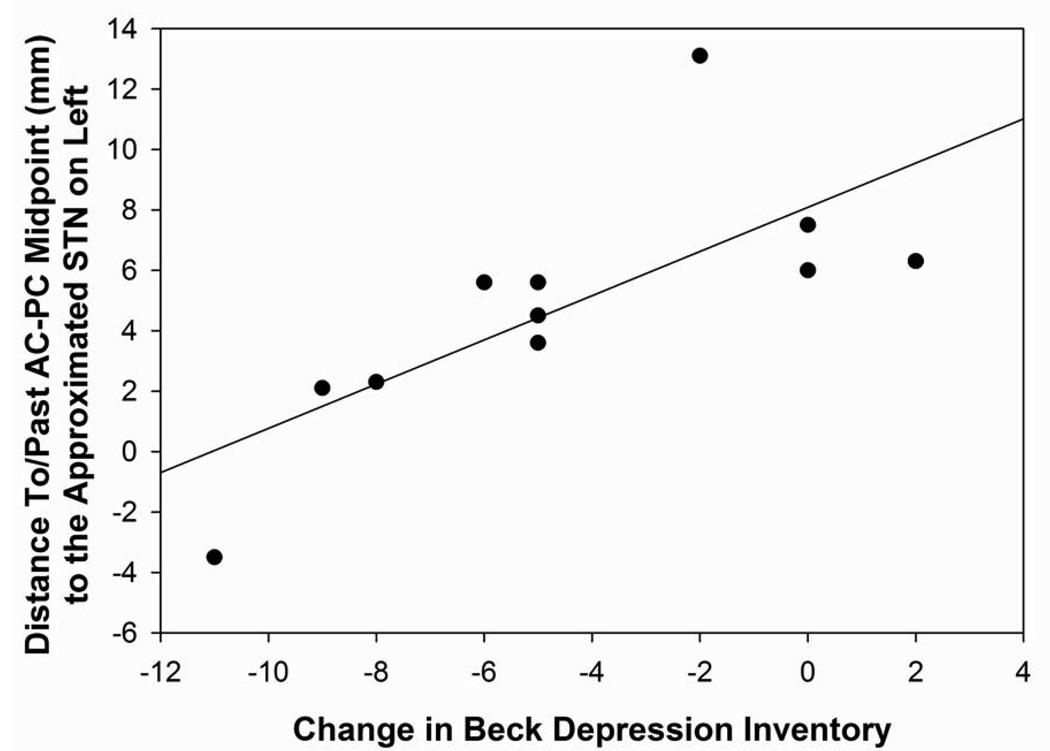
Figure 6. Figures 6A–6D: Distances Off/To/From Approximated STN.
Figure 6A: Scatterplot with regression line demonstrating the relation between the distance (in mm) of the electrode tip off the approximated STN in the right hemisphere and verbal short-term memory difference scores. The lower distance numbers reflect electrodes closer to the approximated STN and a lower difference score reflects a greater decline in verbal short-term recall. (p=0.03)
Figure 6B: Scatterplot with regression line demonstrating the relation between the distance (in mm) o the electrode tip off the approximated STN in the left hemisphere and depression difference scores. The lower distance numbers reflect electrodes closer to the approximated STN and a lower depression difference score reflects an improvement in depression scores following surgery. (p=0.004)
Figure 6C: Scatterplot with regression line demonstrating the relation between the distance of the electrode tip past the approximated STN in the left hemisphere and depression difference scores. The lower the distance past reflects electrodes located in a more posterior direction and a lower depression difference score reflects an improvement in depression scores following surgery. (p=0.003).
Figure 6D: Scatterplot with regression line demonstrating the relation between the distance past the approximated STN for the midpoint of the AC-PC line to the electrode tip in the left hemisphere and depression difference scores. The negative numbers reflect a distance to the approximated STN while positive numbers reflect a distance past the approximated STN and a lower depression difference score reflects an improvement in depression scores following surgery. (p=0.01)


