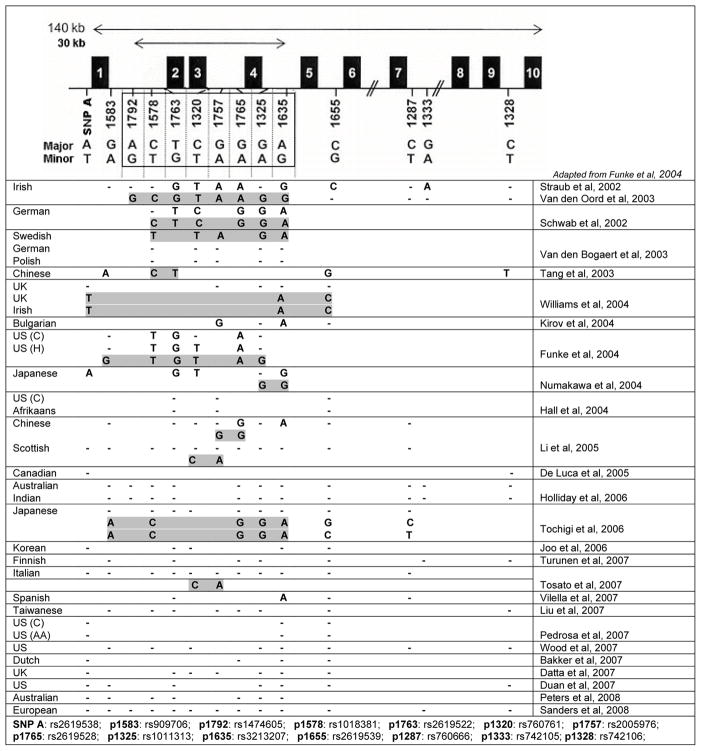
Figure 2.
Summary of published association studies of DTNBP1 and schizophrenia. The 8 SNPs defining haplotypes in Figure 1 are shown boxed in the cartoon at the top. If association was observed for a marker, the associated allele is shown. Dashes (−) indicate markers tested but with no associated allele. Blank cells indicate marker not tested. Allele sets defining associated haplotypes are shown shaded, if any were reported. C: Caucasian; H: Hispanic; AA: African American. Note that the Duan et al. (2007) report observed association but not with markers common to any other study.

