Figure 1.
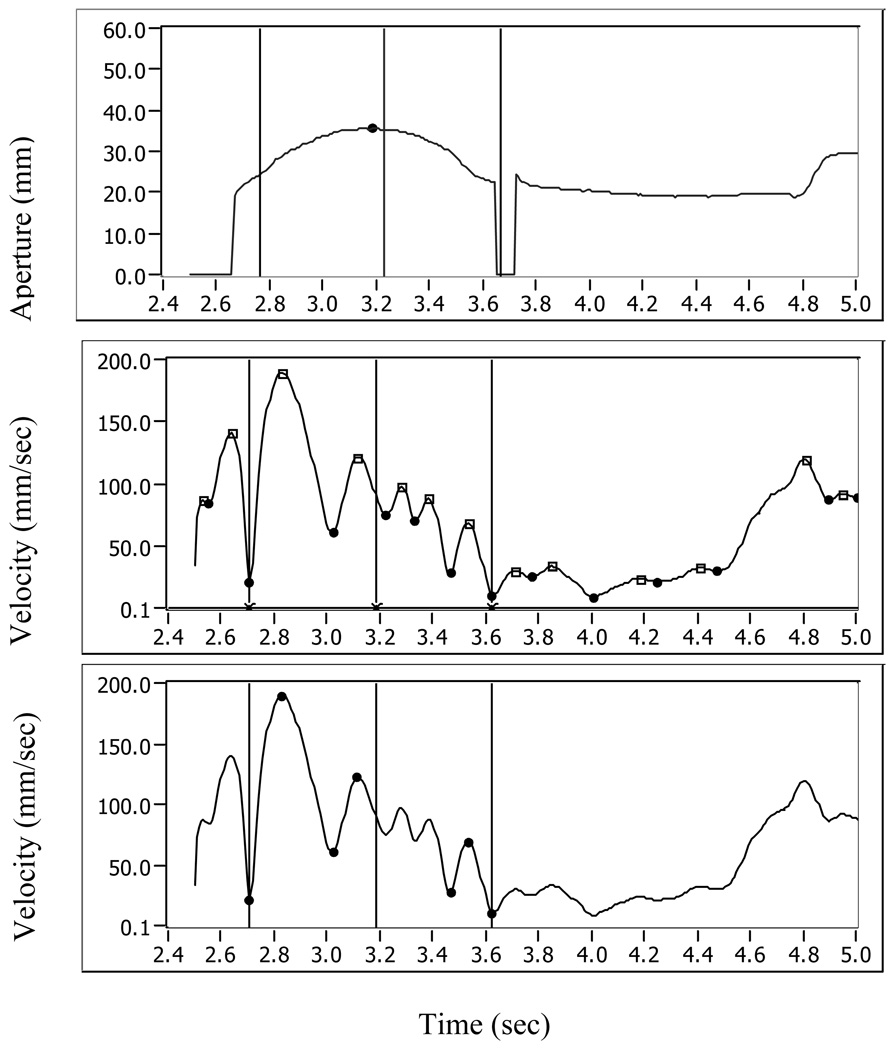
Aperture (upper panel) and wrist velocity (middle and lower panels) data of one representative trial. Upper panel shows aperture data (in mm) during part of a trial. X axis represents time (in sec). Reach onset time, as determined by visual inspection (video coding), is marked by the first vertical line. The middle vertical line represents the time of peak aperture as determined by visual inspection, while peak aperture as determined based on the Optotrak data is marked by a small circle. The last (right) vertical line represents the time of first contact based on visual inspection. Times in which the aperture line drops to zero are times of missing data for either the thumb or pointer markers. The middle panel shows wrist velocity (in mm/sec) and its peaks (depicted by small squares) and valleys (depicted by small circles) plotted against time (X axis). Reach onset (left vertical line) was re-determined as occurring at minimum wrist velocity closest to the reach onset as determined by visual inspection. Peak aperture time (middle vertical line) was adjusted to represent peak aperture time based on Optotrak data.
In the third panel wrist velocity is plotted again with only the peaks and valleys that were used for movement-units (MV) calculation. The trial shown in this panel has 3 movement units

