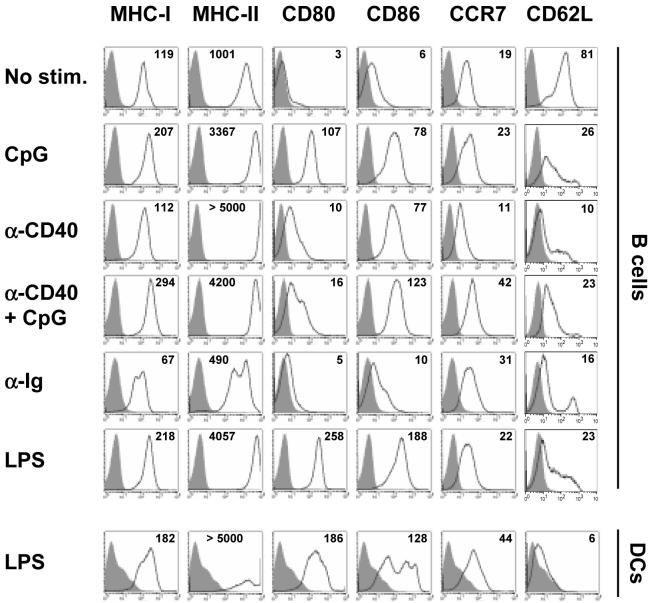
Figure 1. Expression of MHC, costimulatory, and homing molecules on the surface of activated B cells and DCs.
The expression of surface molecules was determined by flow cytometry on freshly isolated unstimulated B cells (No stim.), B cells activated with various agents for 20 hrs, or bone marrow-derived DCs stimulated with LPS for 20 hrs. Numbers represent mean fluorescent intensities. Representative results of four similar experiments are shown.

