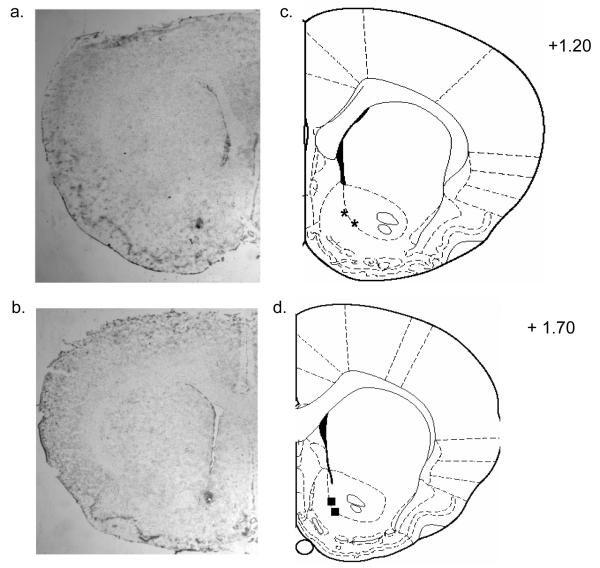
Figure 12. Histological analysis of NAc microinjection.
Figure 12a and b shows representative photomicrograph of the injection site for the NAc. Figure 12c and d shows drawing of serial coronal sections from representative animals used in the experiments. Bilateral symbols show approximate cannulae placement for the NAc at +1.20 mm from bregma (asterisk) and NAc at +1.70 mm from bregma (squares).

