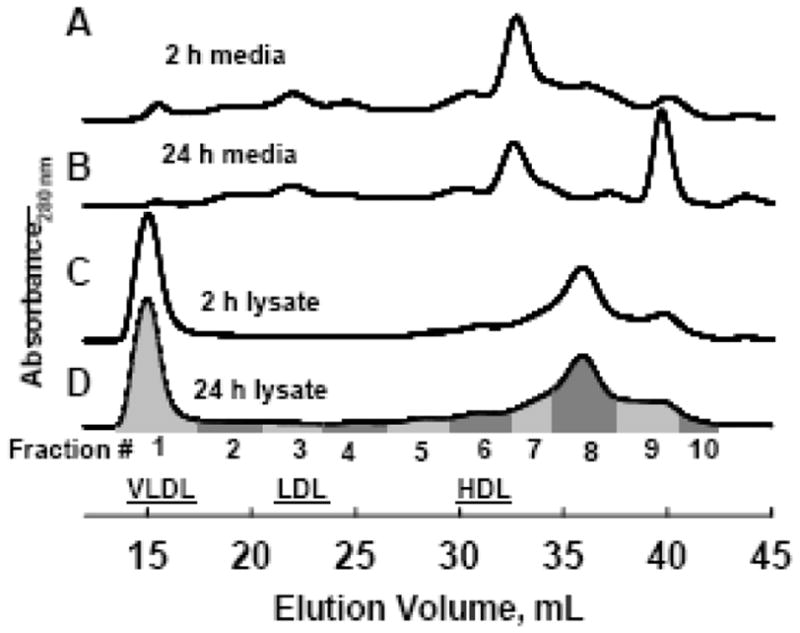
Figure 2. Size exclusion chromatography (SEC) profiles of HepG2 media and lysate samples.

Samples were collected at 2 or 24 h. Eluants were pooled into 10 fractions as indicated by the gray bars, and used for subsequent Western blot analysis of apolipoprotein distribution as in Figure 3. Human plasma VLDL, LDL and HDL peak fractions are 1, 3 and 6, respectively.
