
Figure 7. Model: NEUROG2 activity is limited to a narrower area compared to its expression domain by the function of MTGR1.
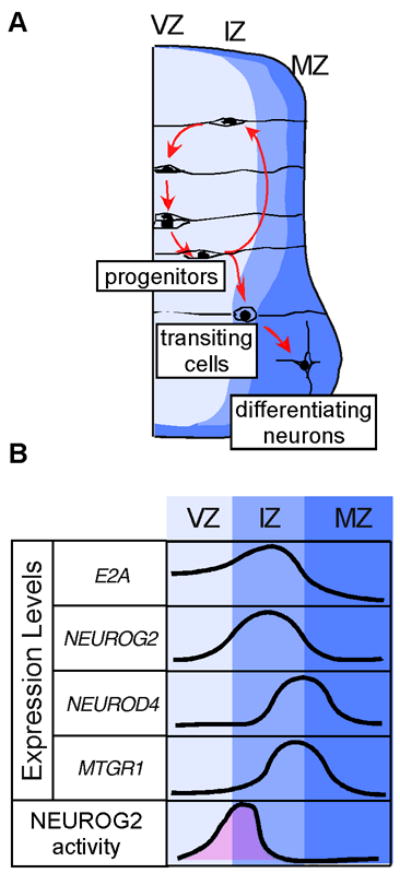
A: Diagram of cell movement during neurogenesis. Progenitors are located in the VZ. After the last mitosis, committed neuronal progenitors migrate to the IZ, and delaminate to the MZ. Note that similar gene expression pattern is observed in development of the mouse central nervous system (Alishahi et al., 2009). B: Relative expression levels of genes studied in this paper. The area shaded in pink represents conceptual transcriptional activity of NEUROG2 based on our findings. Note that the activity of NEUROG2 is limited to narrower window of time compared to the period of its gene expression.