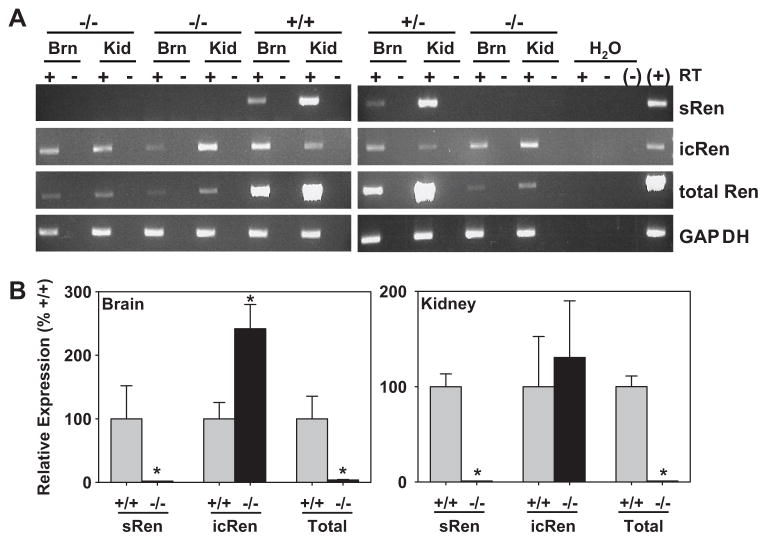
Figure 5. Expression Profile of Renin Isoforms in Fetuses.
A. RT-PCR of the indicated renin isoform mRNAs and GAPDH in brain (Brn) and kidney (Kid) of 18.5 gd fetuses genotypes as indicated. +/− reflects presence or absence of reverse transcriptase (RT) in the reaction. B. Realtime Q-PCR assays on ren-ex1a, ren-ex1b and total renin mRNA in the brain (left) and kidney (right) as indicated. +/+, gray bars; −/−, black bars. *, P<0.05. N=4 for all samples except N=3 for ren-ex1b in brain.

