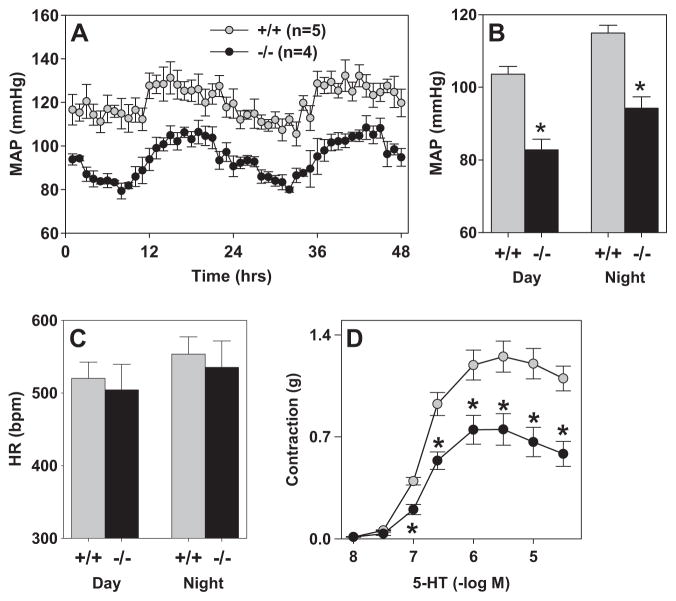
Figure 7. Blood Pressure, Heart Rate and Aortic Function.
A. Hourly MAP over a 48-hr period of +/+ (gray) and −/− (black). B-C. Summary of 10-days of blood pressure (B) and heart rate recording (C) of +/+ and −/− split into day and night time periods. *, P<0.05. N=5 for +/+ and 4 for −/−. D. Contractile response of aorta to 5-HT. N=4 each for +/+ and −/−. *, P<0.02.

