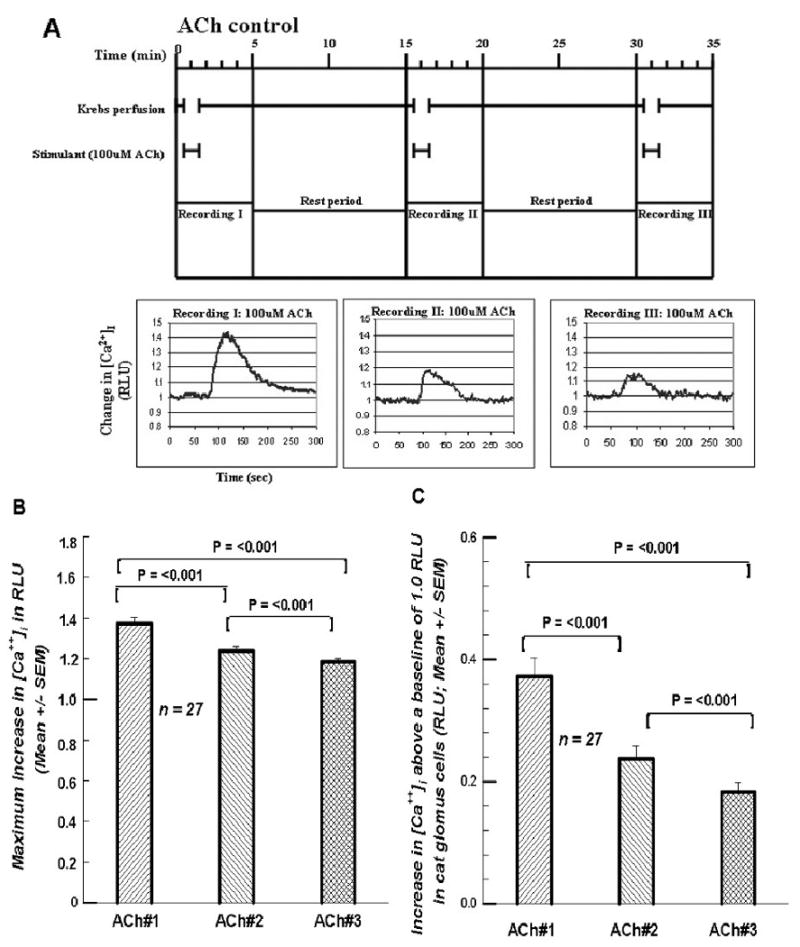
Figures 1.

A. Top of figure shows paradigm for treating each cell. The Krebs perfusion is initiated and allowed to flow for 30 sec. At 30 sec the solution is switched to a Krebs solution containing 100 μM ACh which flows for 60 sec. At 90 sec the ACh-free Krebs starts again up to the 15 min mark. The cycle is then repeated. Recordings are taken for 5 min starting at time 0. Note time lag due to a voiding of the dead space volume in the perfusion plumbing. RLU = relative light units, indicative of intracellular calcium. Three successive exposures to 100 μM ACh generated decreasing RLU values (decreases in [Ca2+]i). 1B. Summary of the 27 cells investigated as in Figure 1A. The decline in [Ca2+]i over the three exposures is statistically significant. RLU-relative light units of intensity. 1C. Summary of the differences between the peak RLU value and the baseline value of 1.0. This value represents the increase due to the treatment. NOTE: Variability indices above all mean bars in the bar graphs of all figures (1-10) represent + 1 SEM.
