
Figures 4.
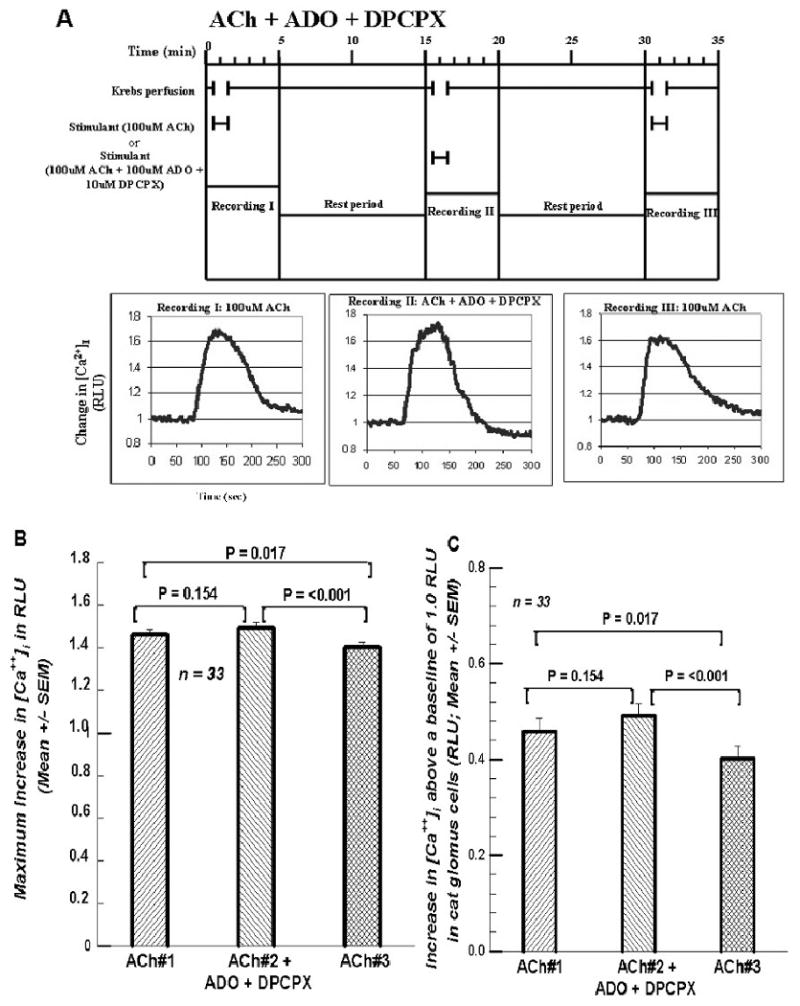
A. Format and paradigm same as in figures 1A, 2A, and 3A except that in the second exposure to 100 μM ACh both 100 μM ADO and 10 μM DPCPX, the A1 ADO receptor antagonist, were added. The peak responses of [Ca2+]i seem to be very similar. 4B. Summary of the 33 cells treated in the manner of the cell presented in Figure 4A. The maximum response of the [Ca2+]i with the inclusion of 100 μM ADO and 10 μM DPCPX was not significant. But the third exposure to ACh alone was significantly less than the first two. 4C. Summary of the increases between the peak RLU value above the baseline RLU value of 1.0. The first two differences are statistically indistinguishable; but both are significantly higher than the increase for ACh #3.