
Figures 5.
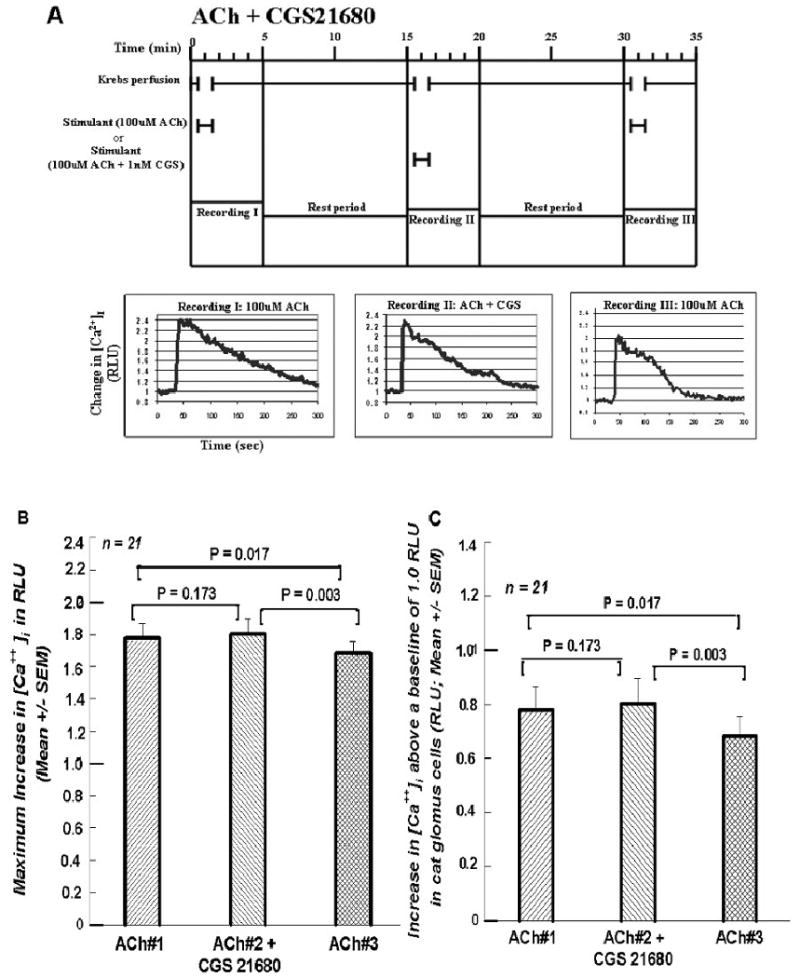
A. Format and procedure same as in Figures 1A, 2A, 3A, and 4A except that in the second exposure to 100 μM ACh 1nM CGS 21680, the A2A ADO receptor agonist, was included instead of ADO. 5B. Summary of the 21 cells treated in the manner of the cell presented in Figure 5A. The first two RLU responses to changes in [Ca2+]i were statistically indistinguishable. But in the third exposure to 100 μM ACh alone the peak RLU response was significantly less than the first two responses. 5C. Summary of the increases as in previous “C” plots.