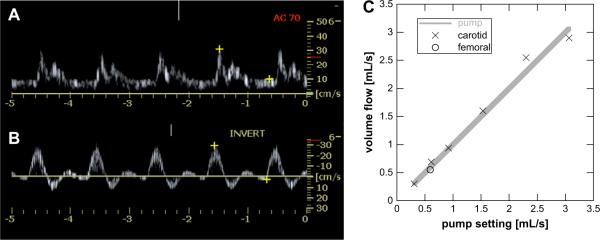
Figure 3.
Doppler waveforms for carotid (A) and femoral flow (B) were generated by the pump system and 3D Doppler data obtained and processed for volume flow. (C) The measured average volume flow rates compare favorably to the actual rates across a range of velocities and for the femoral waveform, which includes reverse flow in its pump cycle. Each point is the result for 50 random volume acquisitions across the cardiac cycle. Rates were within 7.1% of the actual value.

