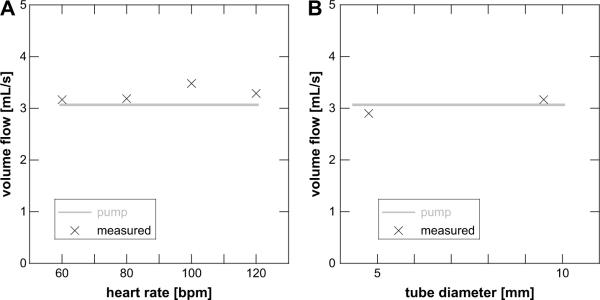
Figure 4.
(A) The measured volume flow rate remains constant in the flow tube experiment across a range of equivalent heart rates of 60 to 120 beats per minute (bpm). Each point is the result for a single data acquisition of 50 random points across the simulated cardiac cycle. (B) Effect of changing flow tube diameter. Note that despite a factor of 2 change in diameter, the measured volume flow rate remains near the actual value. Each point is the result of 50 random volume acquisitions across the cardiac cycle.

