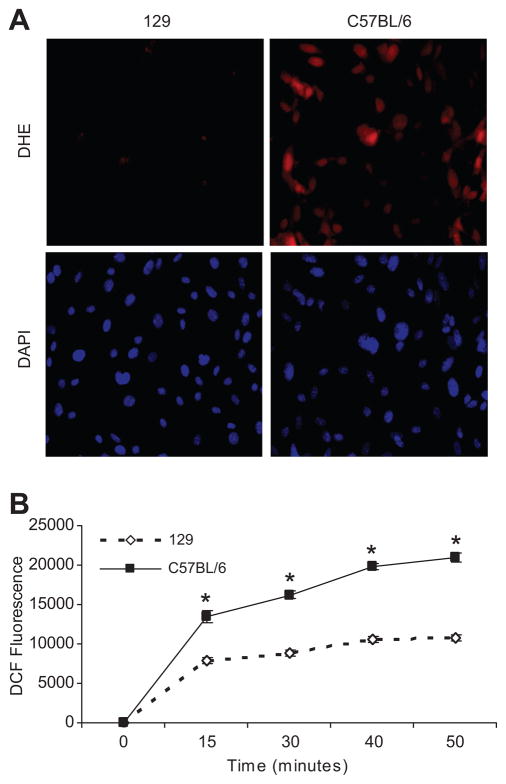
Figure 3. Strain differences in ROS production.
A. DHE staining At relatively equal cell density determined by DAPI nuclear staining (lower left and right panels), there is very low level of DHE staining in the 129 cells (top left panel). However, in C57BL/6 VSMCs, there is dramatically higher level of DHE staining (top right panel), suggesting higher levels of superoxide. B. DCF-DA assay. The DCF fluorescent signal, a measure of H2O2 levels, is significantly higher in C57BL/6 VSMCs compared to 129, * p ≤ 0.001; n = 3 each, performed in triplicates in 3 experiments.

