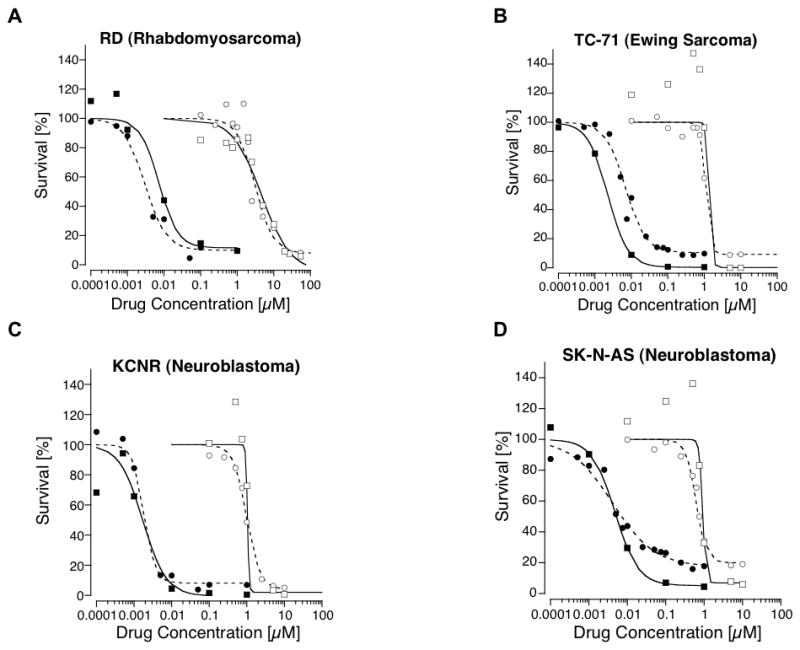
Figure 2.

Cell survival curves for 2 non-neuroblastoma (A. RD and B. TC-71) and 2 neuroblastoma (C. KCNR and D. SK-N-AS) cell lines exposed to a range of concentrations of ABT-751 or vincristine (VCR). Cell survival was measured using from the Sulforhodamine B (SRB) and ACEA RT-CES cytotoxicity assays. Open circles represent the mean survival from multiple replicates and multiple experiments for cell lines exposed to ABT-751 with survival measured with the SRB assay; open squares represent the mean survival for cell lines exposed to ABT-751 with survival measured with the ACEA RT-CES assay; closed circles represent the mean survival for cell lines exposed to VCR with survival measured with the SRB assay; and closed squares represent the mean survival for cell lines exposed to VCR with survival measured with the ACEA RT-CES assay. Lines represent the mathematical model fit to the concentration-survival data - the dashed line for the SRB assay and solid line for the ACEA RT-CES assay.
