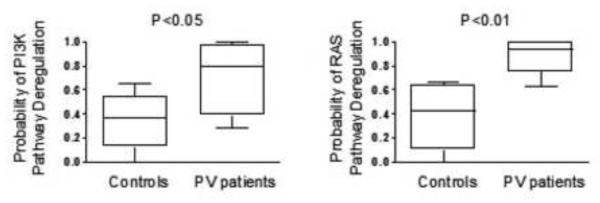
Figure 4. Analysis of RAS and PI3-Kinase pathway activation signatures.
Gene expression signatures of oncogenic signaling pathways to characterize the activation status of RAS and PI3-kinase pathways were applied to data from patients with PV and healthy controls. The probability of PI3-kinase (panels on left) and RAS pathway (panels on right) deregulation in PV erythroblasts are significantly increased compared to normal control erythroblasts.

