
Figure 3. Pattern of blood phe concentrations in Subject 7 with biweekly increases in dietary phe intake.
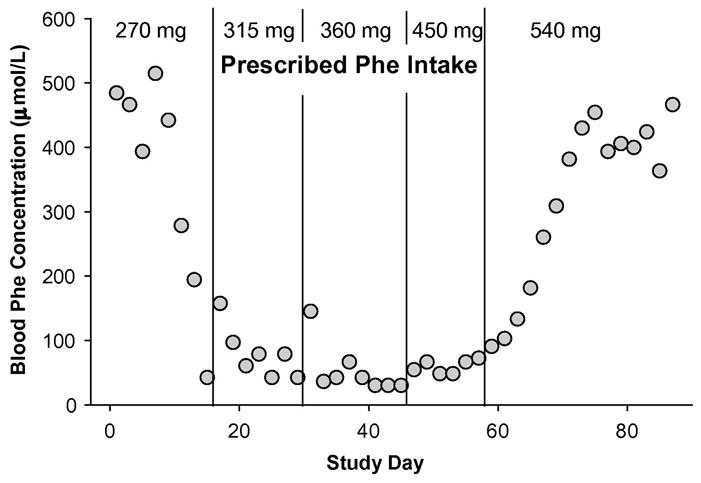
The prescribed phe intake is shown at the top. Agreement between prescribed and analyzed phe intake based on food records was good (4.3% ± 25, n=83): 270 mg prescribed phe, 306 mg ± 43 analyzed phe, n=14; 315 mg prescribed phe, 331 mg ± 54 analyzed phe, n=15; 360 mg prescribed phe, 352 mg ± 98 analyzed phe, n=15; 450 mg prescribed phe, 491 mg ± 155 analyzed phe, n=11; 540 mg prescribed phe, 566 mg ± 103 analyzed phe, n=28. Phe intake values are mean ± SD.