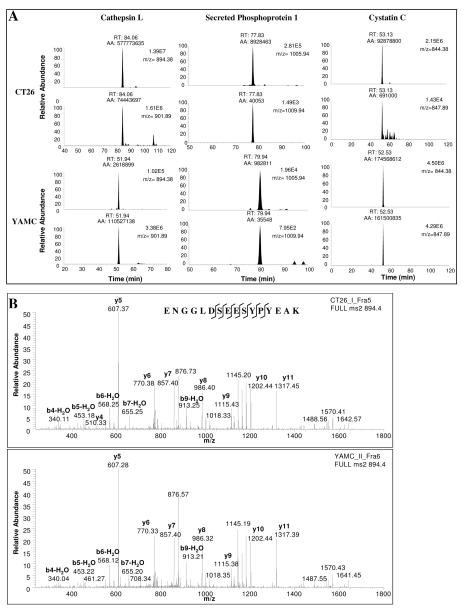
Figure 2.
Examples of extracted ion chromatograms (panel A) for peptides unique to cathepsin L (ENGGLDSEESYPYEAK), secreted phosphoprotein 1 (ESQESADQSDVIDSQASSK) and cystatin C (MLGAPEEADANEEGVR) from SILAP standard containing CT26 and YAMC secreted proteomes. CT26 compared to YAMC peptide levels are calculated by normalizing peak area of unlabeled (top) to labeled (bottom) peptide for each sample, then calculating a ratio across the two samples. The CT26/YAMC expression ratio was 337 for cathepsin L peptide ENGGLDSEESYPYEAK, 8 for secreted phosphoprotein 1 peptide ESQESADQSDVIDSQASSK, and 124 for cystatin C peptide MLGAPEEADANEEGVR. MS/MS spectra (panel B) confirming unlabeled cathepsin L peptide ENGGLDSEESYPYEAK identity in CT26 (top) and YAMC (bottom) samples.

