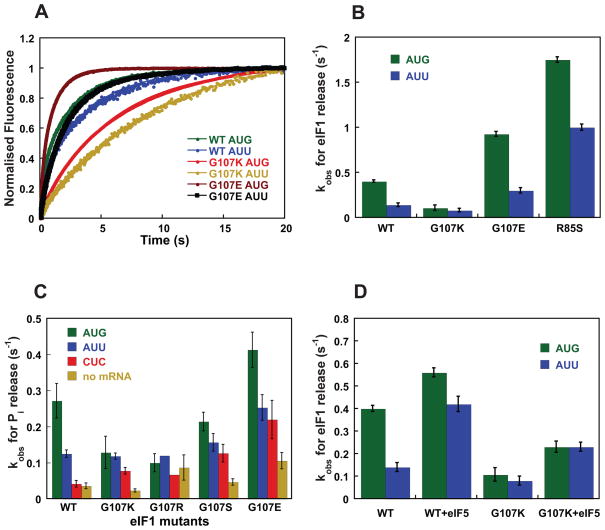
Figure 6. Kinetics of eIF1 and Pi release from the PIC are affected by the charge at and around position 107.
(A) eIF1 release was monitored by following the decrease in FRET (increase in fluorescein fluorescence) between eIF1-Fl and eIF1A-TAMRA in the PIC after addition of model mRNA with an AUG or AUU start codon. Curves were fit with double-exponential rate equations. The fast phase corresponds to a conformational change and the slow phase to eIF1 release. WT eIF1: AUG (green), AUU (blue); G107K: AUG (red), AUU (yellow); G107E: AUG (brown), AUU (black). (B) Comparison of rate constants for eIF1 release from 43S PICs with model mRNA with an AUG (green) or AUU (blue) start codon. (C) Rate constants for Pi release from PICs made with WT and mutant eIF1 in the absence and presence of model mRNAs with different start codons: AUG (green); AUU (blue); CUC (red); no mRNA (yellow). (D) The effect of eIF5 on the rate of release of WT and G107K eIF1 from 43S PICs with model mRNA with an AUG (green) or AUU (blue) start codon.

