
Figure 8. Reconstitution of AREG-EGFR in a Human Lung SCC Line Induces rapid Osteolytic growth in bone.
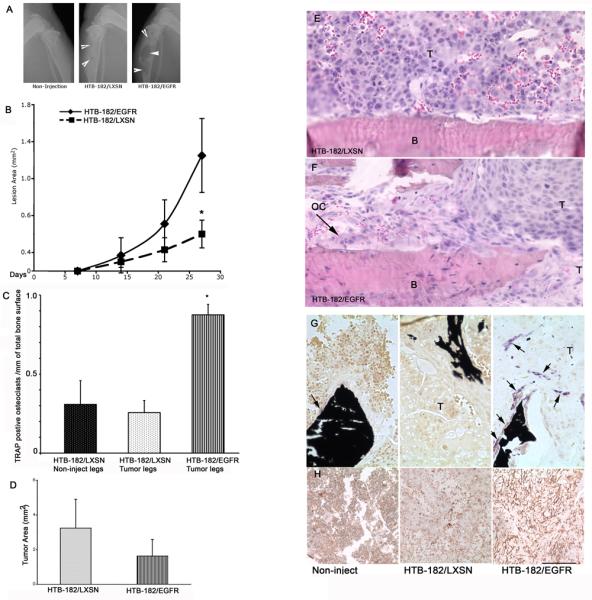
Mice injected with tumor cells were X-rayed at 14, 21 and 28 days after injection. Mice were euthanized and bone processed for histology to confirm take of the tumor within the bone. (A) Final X-rays from an uninjected tibia and those injected with HTB-182/EGFR or HTB-182/LXSN cells (B) The mean area measured from X-rays. X-rays were scanned and then area X-ray lucent regions within the bone were measured with image J. Animal numbers: (n=5 for HTB-182/LXSN vector controls; n=4 for HTB-182/EGFR tumor-bearing mice). Values represent the mean for each group ±SD *P<0.01. (C) Panel represents mean of the average number of TRAP stained osteoclasts counted per section divided by the bone surface length of the section ± SEM of tibia injected with HTB-182/LXSN and HTB-182/EGFR cells as well as the non-injected tibia which is taken from animals that had been injected in the other leg with HTB-182/LXSN cells (n=5). 8 sections were evaluated for each of the tibias and *P<0.01. (D) Panel represents average tumor area measured with Image J on micrographs from H&E stained sections ± SEM. (6 sections were evaluated for each of the tibias) (E&F) Medium power micrographs of tibias stained with H&E showing distribution of tumors within the bone. OC= an osteoclast T= tumor cells and B= bone. (G) Micrographs from TRAP stained/ Von Kossa counter stained sections focusing on bone trabeculae in the upper diaphysis region where tumors were present. Note the great number of TRAP positive (purple stain and arrows) osteoclasts on the bone surface as well as within the HTB-182/EGFR tumor. (H) Micrographs of EGFR immunohistochemistry. The non-injected sample illustrates some staining of cells of the marrow. The HTB-182/EGFR tumor cells exhibit robust staining of the cell periphery and such labeling was not present in the HTB-182/LXSN tumor cells. Scale bar in lower right hand panel represents 60 μm in (E-G), 120μm in (H)