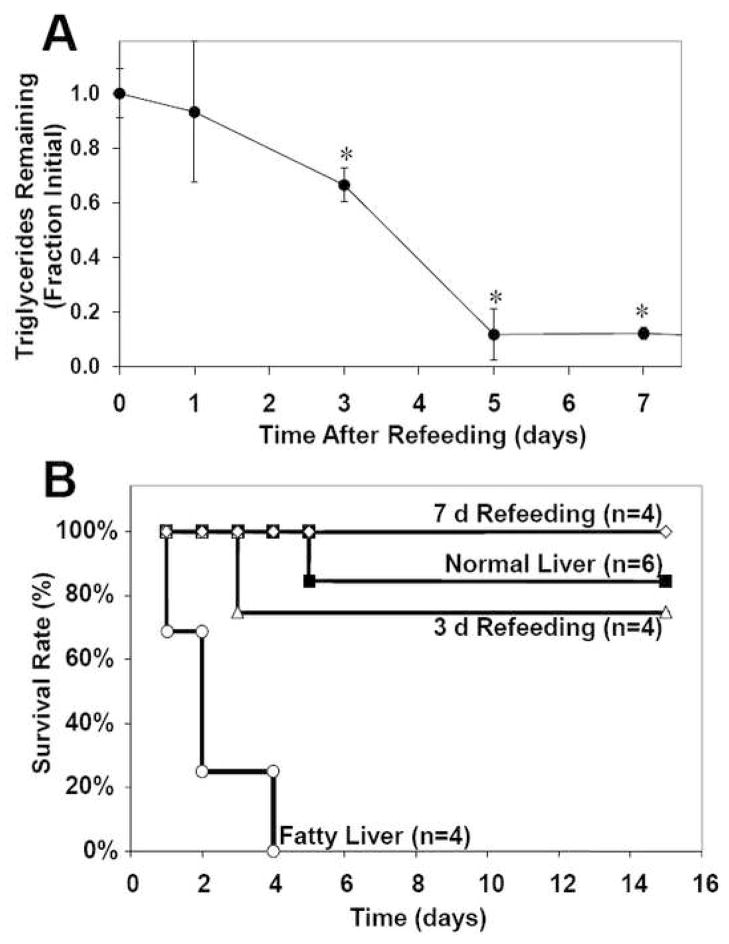
Figure 1.
Correlation between liver triglyceride content and survival rate after transplantation in a fatty liver rat model. Fatty liver was induced by feeding a choline and methionine-deficient diet for 6 weeks, after which the rats were returned to a normal diet. (A) Effect of refeeding time on liver triglyceride content. Initial content was 220±20 mg/g liver. *: significantly different (p<0.05) compared to initial triglyceride content by Student’s t-test. (B) Effect of refeeding time on survival curves of rats. Fatty liver curve is significantly different (p<0.05) from the other groups.

