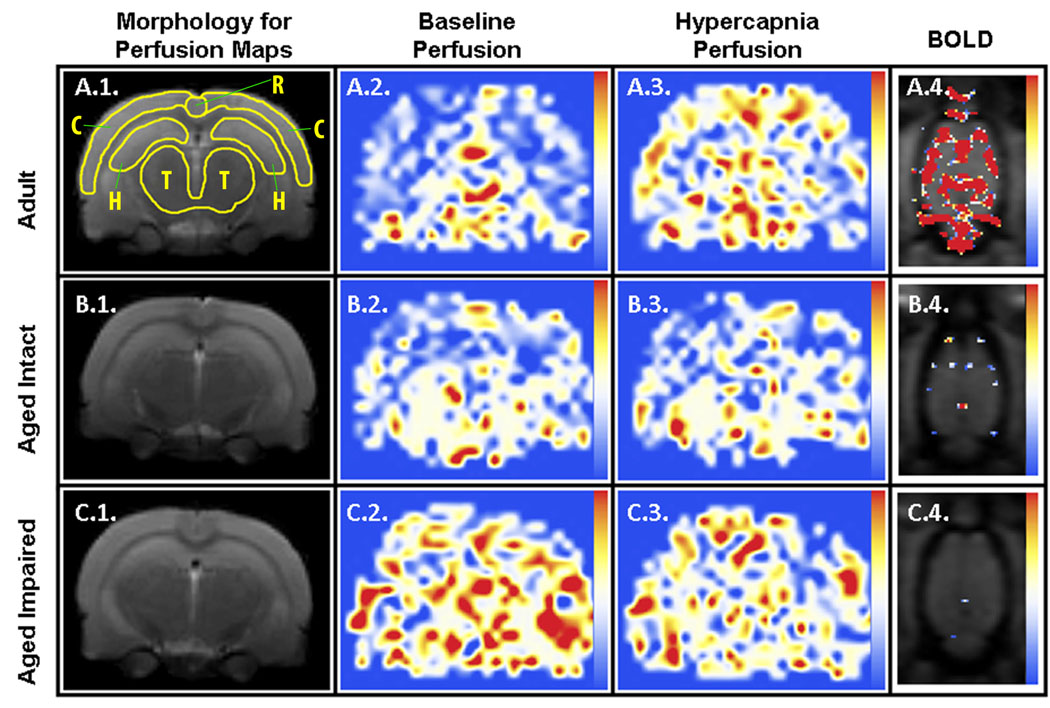
Figure 4. Representative MR-derived parametric maps.
Coronally-oriented perfusion maps of adult (row A), aged intact (row B), and aged impaired (row C) animals before (column 2) and during (column 3) hypercapnia are linearly color-coded from 0 (blue) to 150 (red) ml / (100g × min) using the color scale shown on the right, and cropped to final dimensions of 9.1mm×11.6mm. Corresponding morphologic RARE reference images are shown (column 1) along with the regions of interest used for analyses as yellow outlines (A.1.; C: whole cortex, T: thalamus, R: restrosplenial cortex, H: dorsal hippocampus). BOLD correlation maps (column 4) between the T2*-weighted signal and hypercapnia stimulation are represented using the linear color scale shown to the right, with correlation values ranging from 0.6 (blue) to 0.8 (red). The first T2* image of the series is used as a grayscale background for morphological reference. Here, only one of the 8 available horizontal slices is shown, cropped to final dimensions of 25mm×17.7mm. Statistical analysis (Fig. 5) was performed only on those pixels that intersect the FAIR coronal section of the brain.

