
Fig. 4.
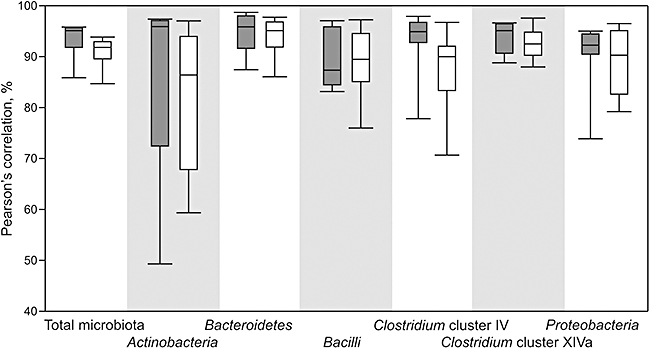
Similarity of the intestinal microbiota profiles for ten individuals calculated for 1 (grey bars) and two month (open bars) span. Results for total microbiota and six level 1 groups of the microbiota (phyla Actinobacteria, Bacteroidetes and Proteobacteria, and three groups within the Firmicutes phylum) are presented as box whisker plot. The box extends from the first quartile until the third quartile, with a line at the median, while whiskers are indicating minimal and maximal observation in the data set.