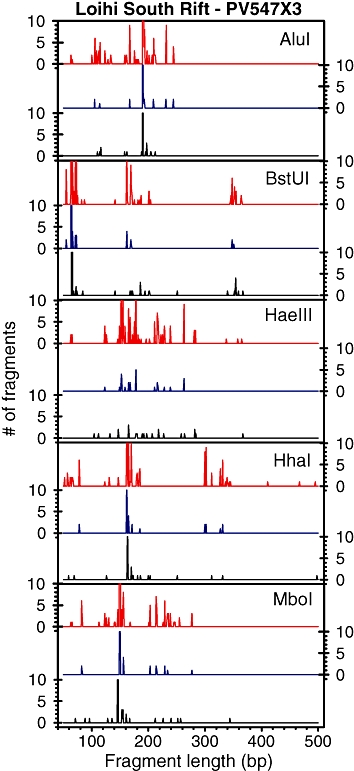
Fig. 1.

Comparison of TRFLP patterns from the South Rift sample. Red lines indicate number of fragments from the measured TRFLP with the respective enzymes when assuming a threshold cut-off of 15 fluorescence units; blue lines indicate the number of fragments from the measured TRFLP with the respective enzymes when assuming a threshold cut-off of 50 fluorescence units; and black lines indicate the number of TRFLP fragments generated from in silico digest of nearly full-length 16S rRNA sequences using the respective enzyme pre-sets in the tRF-cut program in ARB. Some peaks are larger than y-scale given, small y-scales given to highlight rare OTUs (shorter peaks).
