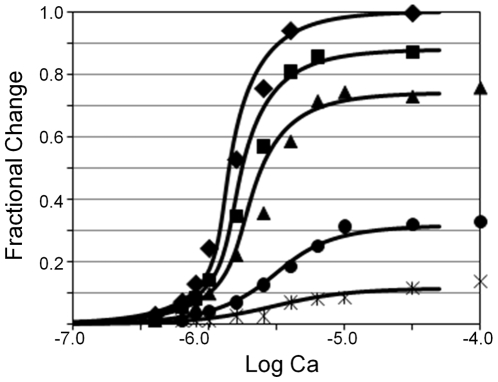
Figure 4. Fit of isometric tension data.
Tension data are taken from [28]. The symbols represent the fractional change in isometric tension of skeletal muscle fibers reconstituted with a mixture of wild-type Tn and mutant Tn unable to bind calcium; the mole fraction of wild-type Tn is indicated as, filled diamond (100%), square (80%), trianlge (60%), circle (20%), cross (15%). Theoretical curves represent the mole fraction of Tm in Positions C and M, which is a measure of fractional activation. C and M are determined for arbitrary calcium by solving Eqs. 9, 18, 21, and 22. We normalized the raw simulations by subtracting the baseline (value at lowest calcium) and setting the maximum value (100% wild-type Tn at saturating calcium) equal to 1. The raw simulation with 100% wild-type Tn appears in Fig. 3 (Curve 7). Curves from left to right were generated with the following percentages of wild-type Tn: (left to right) 100% ( ), 83% (
 ), 70% (
 ), 33% (
 ), 15% (
 ). Adjustable parameters:
p. Constants:
 ,
,  ,
,  ,
,  ,
,  ,
,  .
.

