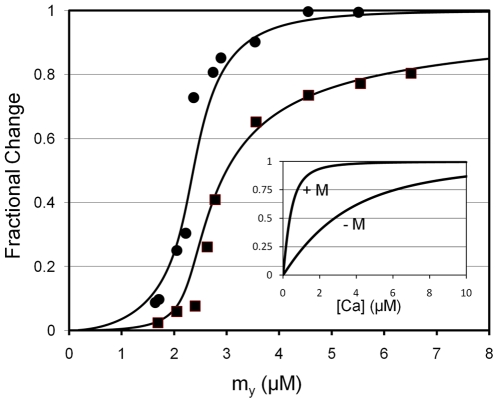
Figure 5. Relationship of IANBD fluorescence data and total myosin binding.
All data are replotted from Trybus and Taylor [16]. Fluorescence data (circles) are fit by eye with Eq. 24, given  and
and  ; the curve through the data is generated by Eq. 23 using
  . Total myosin binding data (squares) are fit with a curve representing the sum of coupled and free myosin binding using Eq. 25. As inputs to Eq. 25, coupled myosin binding is given by the change in fluorescence generated by Eq. 23 (
 ) and the free myosin binding is generated by simple mass action (
 [4]; Eq. 26). Inset. Simulated calcium binding to Tn is non-cooperative. The sum of B2, B3, T2, and T3 (Table 1), which represents the total calcium bound to Tn, is plotted on the Y-axis. Values for these dependent variables were determined by solving Eqs. 9, 18, 21, 22 for arbitrary calcium. Total calcium binding with zero myosin (−M) and saturating myosin (+M) was simulated using K
0 = 0 and
  , respectively. Fixed inset parameters:
  ,
,  ,
,  ,
,  ,
,  .
.

