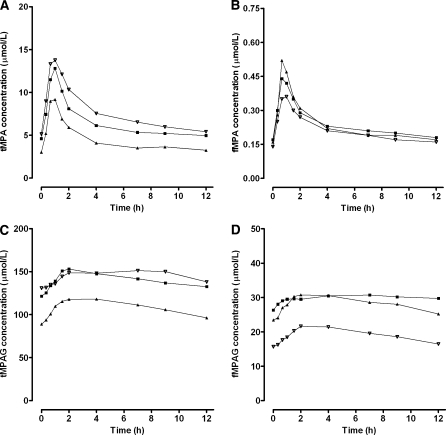
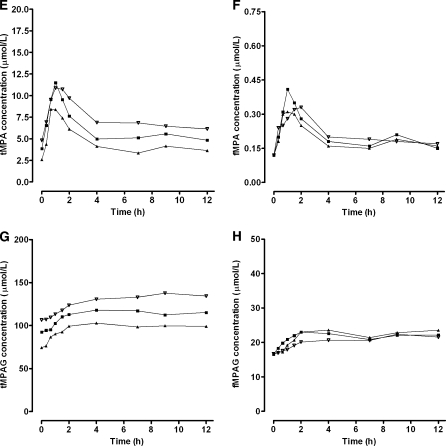
Fig. 5.
Influence of albumin concentrations on pharmacokinetic profiles. Median concentration–time profiles of a tMPA, b fMPA, c tMPAG and d fMPAG in patients cotreated with CsA and concentration–time profiles of e tMPA, f fMPA, g tMPAG and h fMPAG in patients cotreated with tacrolimus. Concentration–time profiles were simulated for 50 patients with albumin concentrations of (filled triangle) 0.4 mmol/l, (filled square) 0.5 mmol/l and (inverted triangle) 0.6 mmol/l


