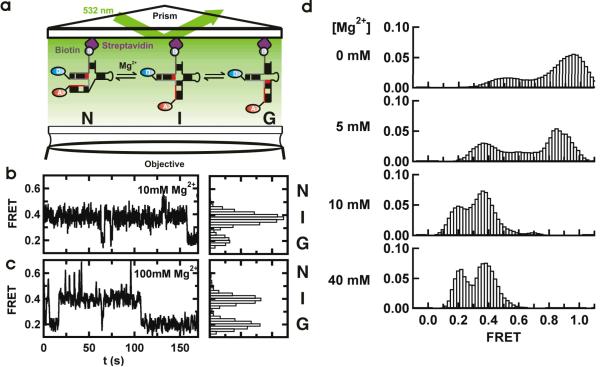
Figure 2.
Single-molecule FRET reveals a three-state folding pathway. (a) Schematic diagram of the single-molecule experiments. The RNA complex is surface-immobilized via a biotin-streptavidin bridge. The fluorophores are excited in a prism-based total internal reflection microscope. Fluorescence is collected by the objective and monitored with a CCD camera. (b and c). Single-molecule FRET time trajectories in 10 and 100 mM Mg2+. The different conformations (N, I and G) can be identified by their FRET ratios (~0.6, ~0.4 and 0.2) in the corresponding FRET histograms. (d) Mg2+ ions modulate the stability of the U2/U6 conformations. Each panel corresponds to an average smFRET histogram from >100 single-molecule trajectories as a function of [Mg2+], as indicated. In the absence of Mg2+, a high FRET state predominates the histogram. As [Mg2+] increases, the 0.4 and 0.2 FRET states become more populated.

