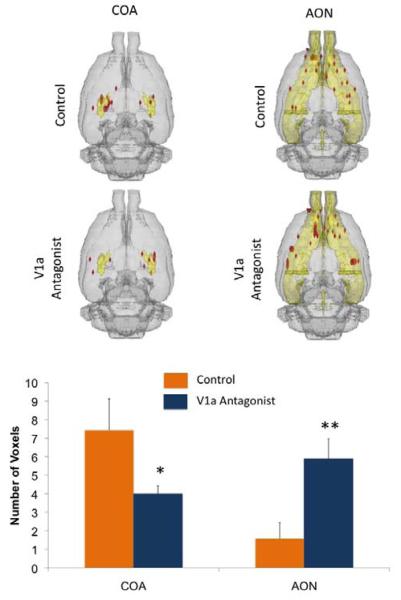
Figure 2.
Number of positive BOLD voxels in control and V1a antagonist treated dams presented with a threat to pups. Top: Composite 3D brain volume maps showing positive BOLD signal changes in the amygdaloid complex and the olfactory system. Bottom: Number of positive BOLD voxels (mean ± SEM) in the cortical amygdala (COA) and anterior olfactory system (AON) of control and V1a antagonist treated dams. * F = 5.2, p = 0.03 and ** F = 8.6, p = 0.01, single factor analysis of variance.

