
Figure 2.
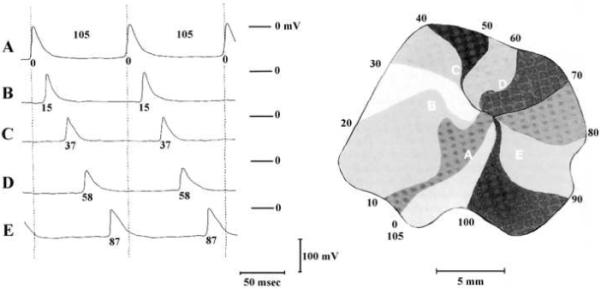
Map of the spread of activation during reentry in a piece of isolated left atrial muscle during a period of sustained tachycardia as constructed from time measurements of the action potentials of 94 different myofibers. The impulse is continuously rotating in a clockwise direction with a revolution time of 105 ms. At the left are shown the transmembrane potentials of five fibers which lie along the circular pathway (A-E). The moments of depolarization, in ms, are given together with the action potentials and the isochronal lines of the map. Used with permission.18