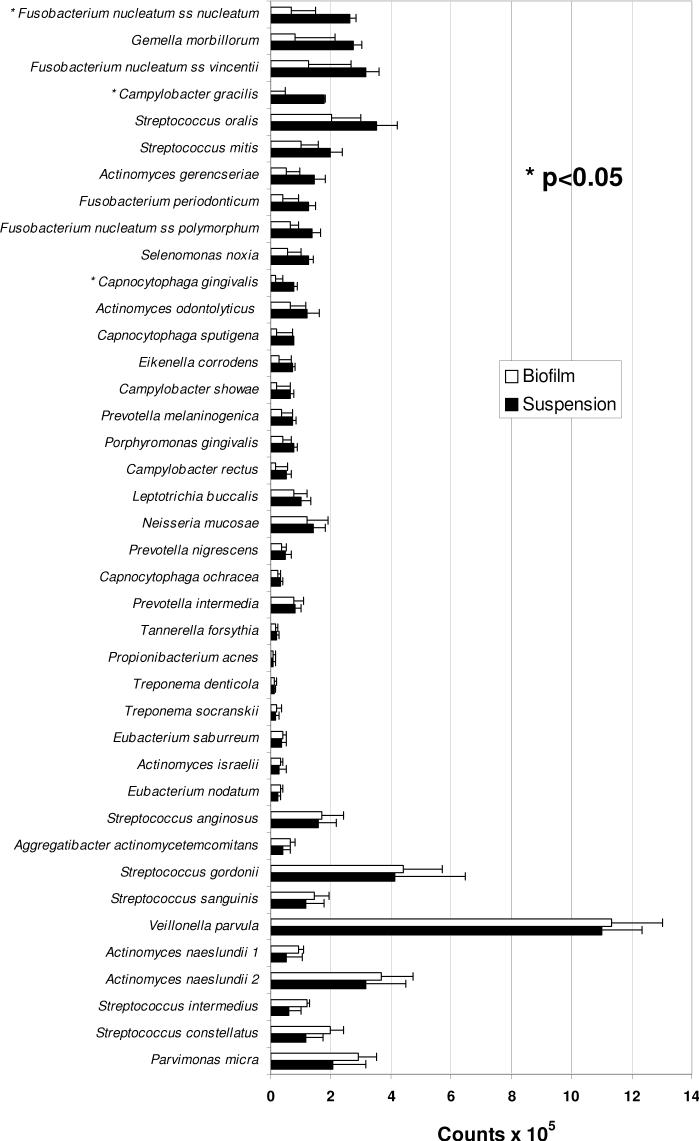
Figure 2.
Profiles of mean DNA counts of 40 microorganisms in dental plaque samples (suspensions) and plaque-derived biofilms. Each bar is the mean (× 105) of values obtained from 5 subjects (6-10) with chronic periodontitis (data from each subject were representative of 3-4 independent suspensions or biofilms). Error bars denote the standard error of the mean. No significant differences in species levels were found in statistical comparisons between suspensions and biofilms after applying Bonferroni criteria (with overall alpha=0.10) to adjust for multiple comparisons.

