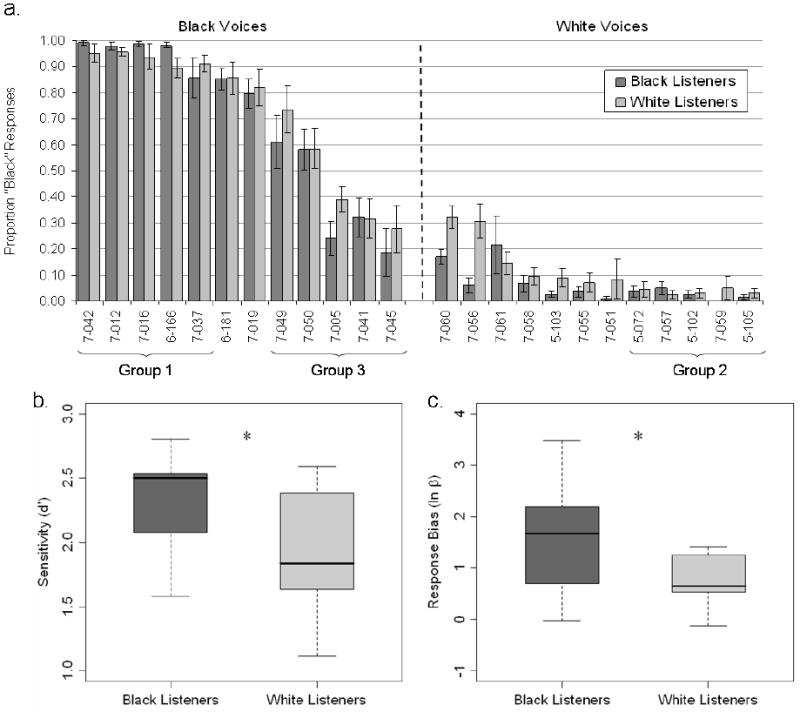
Figure 2.

Racial categorization of voices by listener group. (A) Proportion of “Black” responses for each voice by Black (dark bars) and White (light bars) listeners. Black voices are shown on the left, White voices on the right. Error bars represent standard error of the mean. Voices are ordered by the overall frequency of categorization as “Black.” Brackets below the abscissa indicate voices used in the three talker groups in Experiment 2. (B) The Black listener group was significantly more sensitive to the presence of Black racial information in the categorization experiment (p < 0.05). A dark horizontal line indicates the mean, the filled rectangles encompass the interquartile range, and high-low bars indicate maximum and minimum points. (C) Black listeners were significantly more conservative than White listeners in their categorization of voices as sounding Black (p < 0.035).
