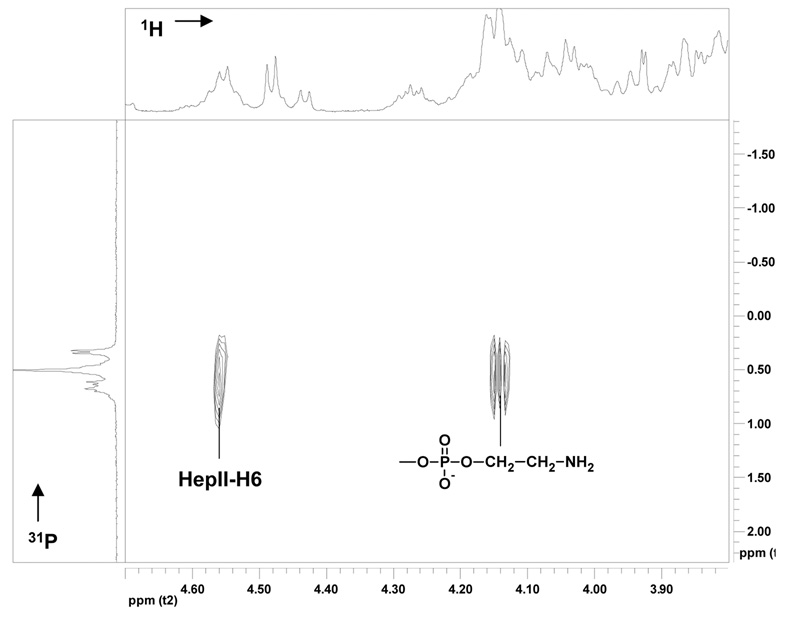
Figure 6.
1H-31P HMQC NMR spectrum of OS1 isolated from NMA-LOS and purified by a Bio-Gel P4 column. The data were acquired at 27 °C at pH 6.8 on a Varian 500-MHz instrument. The projection on top represents 1D proton spectrum and the projection on left hand side the 1D phosphorus indicating the connectivity between the phosphate and sugar ring.

