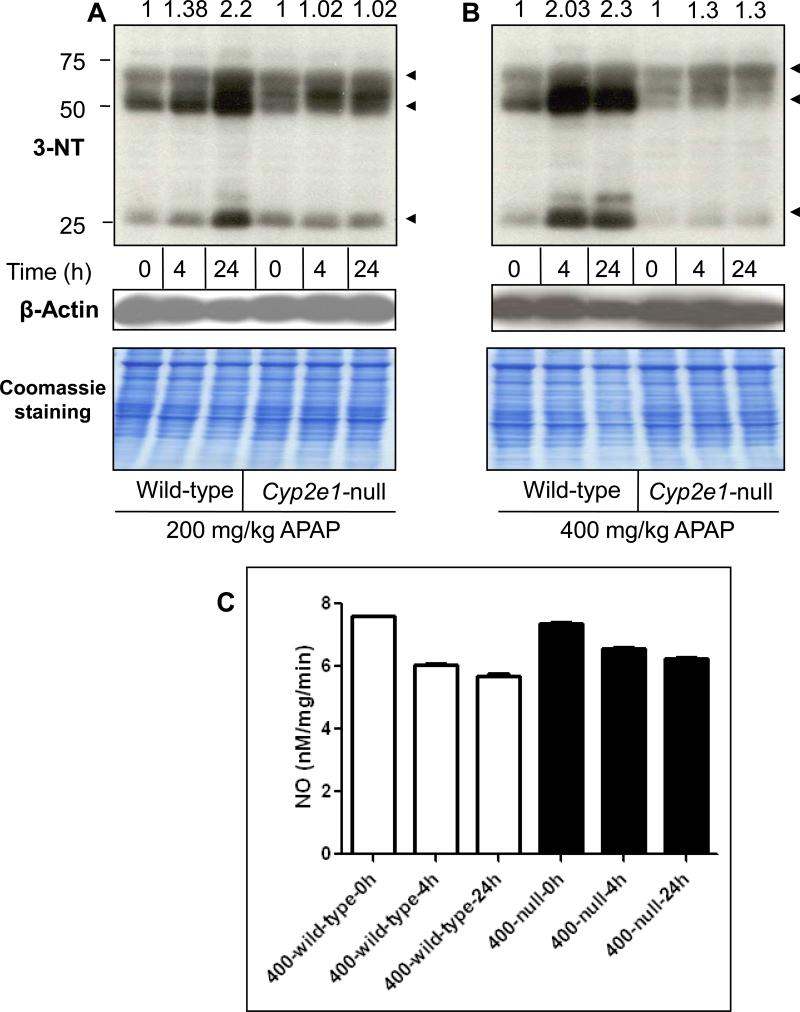
Fig. 2. Levels of hepatic protein nitration and NOS activity in wild-type and Cyp2e1-null mice following APAP treatment.
Equal amounts of liver cytosolic proteins (40 μg/well) from different groups were separated on 12% SDS–PAGE, transferred to nitrocellulose membranes, and subjected to immunoblot analysis by using anti-3-NT antibody (A and B, upper panels) and anti-β-actin antibody (A and B, middle panels) for normalization. Coomassie-stained gels are also presented (A and B, lower panels) to further demonstrate equal protein loading. The relative ratio of the 3-NT level detected between the APAP-exposed samples and the corresponding control, which was set at 1, is shown in the top. Equal amounts of liver cytosolic proteins were used to measure total NOS activity (C) according to the manufacturer's instructions.

