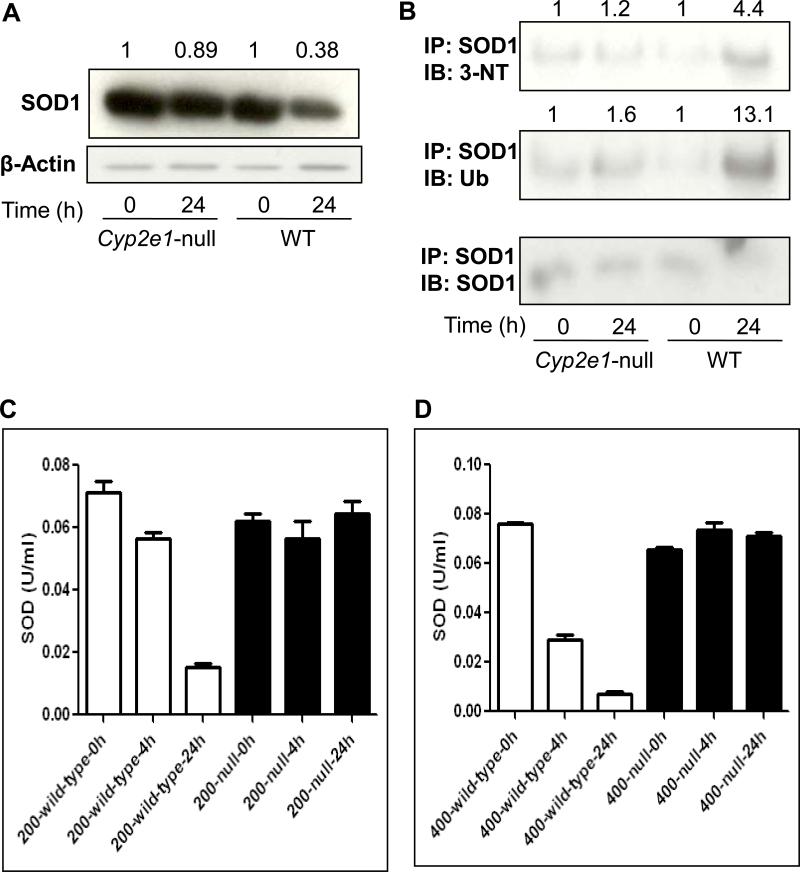
Fig. 6. Levels of cytosolic SOD1, nitrated SOD1, ubiquitinated SOD1, and activity in wild-type and Cyp2e1-null mice treated with APAP.
Equal amounts of or cytosolic proteins (20 μg protein/well) from different groups were separated on 15% SDS–PAGE, transferred to nitrocellulose membrane, and subjected to immunoblot analysis by using the specific anti-SOD1 antibody (A, upper panel) or β-actin (A, lower panel). Density of SOD1 band in each lane was calculated by quantitative densitometry, normalized to that of the corresponding β-actin bands. The relative ratio is presented for the SOD1 level detected in the corresponding control group, which was set at 1, and APAP-exposed groups. Immunoprecipitated proteins from each group were then subjected to immunoblot analysis with the anti-3-NT (B, top panel), anti-ubiquitin (Ub) (B, middle panel), or anti-SOD1 antibody (B, bottom panel). Density of 3-NT or ubiquitin bands was normalized to that of the corresponding SOD1 band. The relative ratio of the immunoreactivity against each target protein detected between the control (set as 1) and APAP-exposed samples is shown in the top. The enzyme activity of SOD was measured using commercially available kit following the manufacturer's protocol in both wild-type and Cyp2e1-null mice treated for 4 or 24 h with 200 mg/kg (C) or 400 mg/kg APAP (D).

